Investing in 3x Daily Leveraged Nasdaq 100 ETFs (TQQQ or QQQ3) using QQQ weekly MACD signals
For the past few months I have been backtesting a long-term investing strategy with a friend, and we started following it since 2 months ago.
The backtesting results are great. More than +10,000% total profit from 2012 to 2025. Hopefully the future results will be too.😉💸

All backtesting is done in TradingView (referral link so we both get $15) using their awesome PineScript platform and the strategy tester. I love it.
Table of contents
- TLDR
- Assumptions and goals
- Past research with leveraged ETFs
- Room for improvement
- Risk management with stop losses
- Tricks and tweaks
- Backtesting
- Open questions
- Conclusion
TLDR
The strategy executes trades on 3x daily leveraged Nasdaq 100 ETFs (TQQQ in the US, and QQQ3 in the UK) using price signals from the original non-leveraged QQQ.
The strategy exploits, and depends on, the massive bull runs of the Nasdaq 100 index (see Nasdaq 100 components). Using 3x daily leveraged ETFs makes the bull runs bigger and allows the strategy to generate amazing gains on the way up, since QQQ gaining a 1% means the 3x leveraged gain is about 3%.
However, using 3x daily leveraged ETFs also magnifies the losses on the way down, so the strategy employs strict risk management in order to cap and minimize the losses while retaining the bulk of the profits.
For the rest of the article we will focus on QQQ3 which is the 3x Daily Leveraged Nasdaq 100 instrument available for trading in Europe. For folks trading in the US check out TQQQ.
OK, but what is the strategy? …
Well, you have to read the article for the details.
If you just care for the results, jump to the backtesting section.🚀
Assumptions and goals
If any of these assumptions does not hold anymore, then the strategy won’t perform as well. You have been warned!
- The US tech industry will continue to outperform the market over the next 10-15 years.
- The new technology leaders will continue to list in the Nasdaq, otherwise the Nasdaq 100 index will lose its advantage.
- Historically, the Nasdaq 100 has a big bull run every few years and overall trends upwards. This allows the strategy to offset losses made in whipsaw markets (oscilating up and down without clear trend).
These are the goals of the strategy and my personal constraints.
- The strategy has to outperform the buy-and-hold Nasdaq 100 or S&P 500 over 10-15 years.
- The strategy has to have better risk management from the buy-and-hold, with less overall drawdowns.
- No intra-day trading. I don’t have the time to sit in front of charts during the day, so working with closing prices only.
- No more than 5 trades per month. The fees and the UK capital gains taxes will reduce profits.
- Simple and easy to follow and execute.
To repeat the most important rule, the strategy has to be simple to reason about and easy to execute. There is no point having a strategy that is hard to execute correctly.
Past research with leveraged ETFs
After experimenting for a few weeks, we found a research published in 2016 by Michael A. Gayed (then updated to cover 2020) solidifying our findings and making them more concrete.
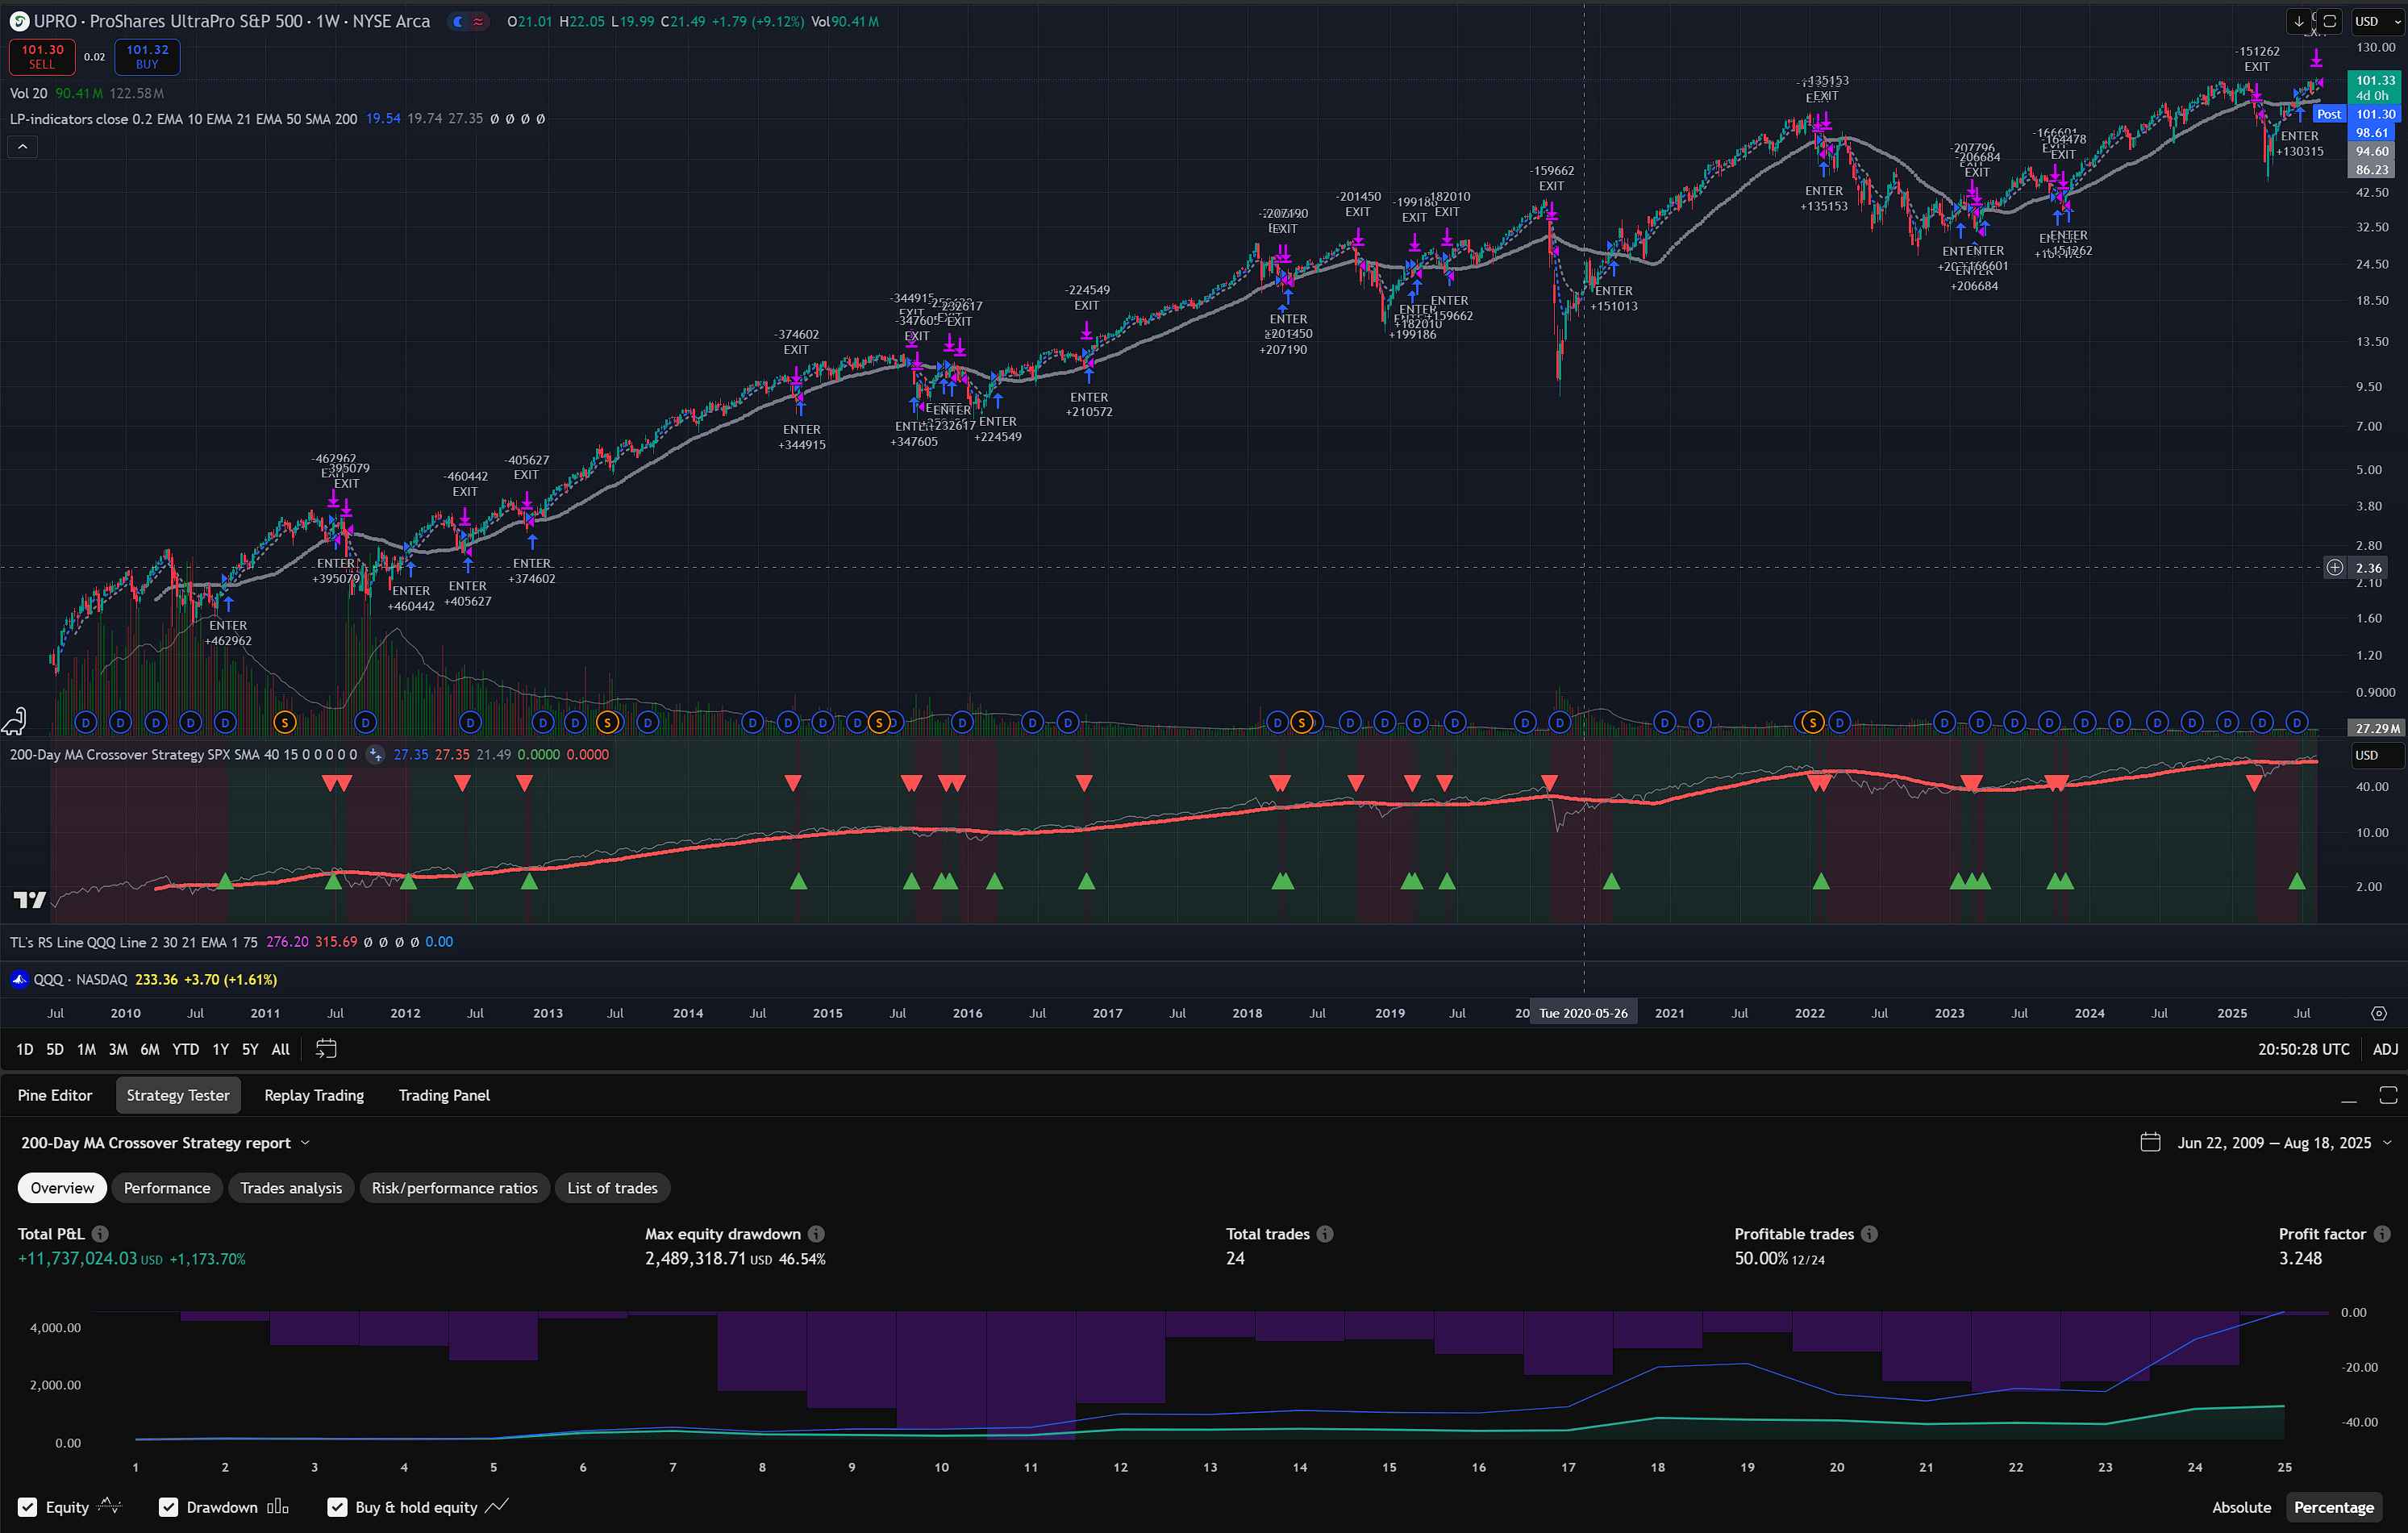
The publication “Leverage for the Long Run - A Systematic Approach to Managing Risk and Magnifying Returns in Stocks” uses the S&P 500 (largest 500 US companies) and crossovers with moving average indicators (MA) as entry and exit signals, reducing the drawdown versus buy-and-hold. Then, goes on to use leveraged ETFs (1.5x, 2x, 3x) to magnify the bull runs (gains) while also managing the drawdowns using the 200 daily moving average.
Quoting from the publication’s abstract:
This strategy shows better absolute and risk-adjusted returns than a comparable buy and hold unleveraged strategy as well as a constant leverage strategy. The results are robust to various leverage amounts, Moving Average time periods, and across multiple economic and financial market cycles.
This is a great read with lots of backtesting going back to 1928, and explains well the drawdown reduction is achieved.
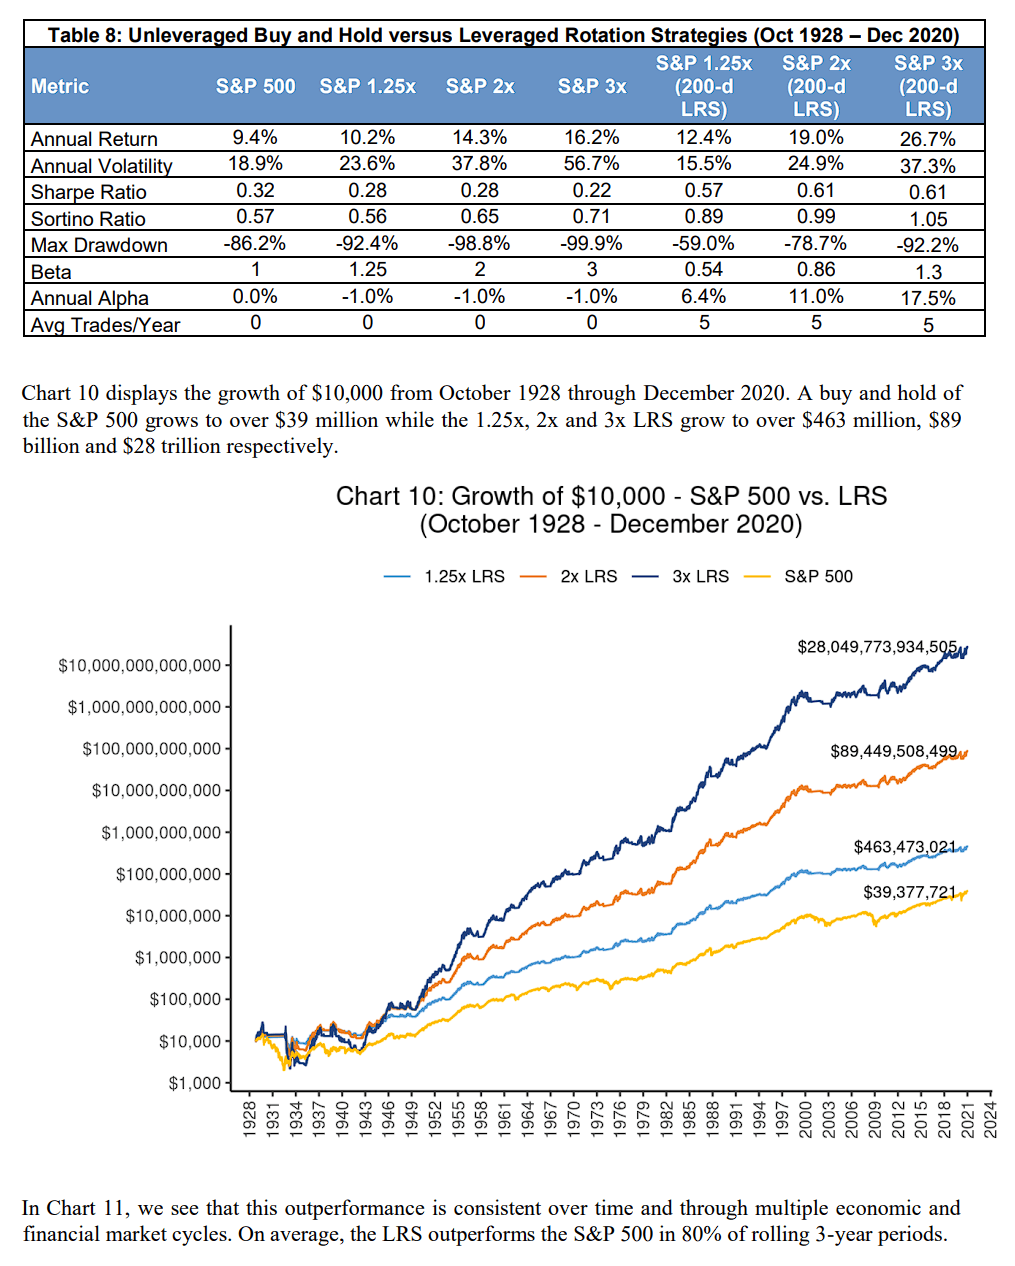
The above table and chart from the publication shows the impact of taking advantage of leveraged gains and capping the losses. Superb results.
Others have also discussed similar strategies, like this analysis by Logan Kane “The Trading Strategy That Beat The S&P 500 By 16+ Percentage Points Per Year Since 1928” that cites the publication above too.
Room for improvement
Even though the above research shows great potential and gives a concrete way to outperform the market (S&P 500 in that case), we can do even better.
We implemented the 200-daily Simple Moving Average (SMA) strategy of the publication using the QQQ3 ETF (3x leveraged Nasdaq 100) with 1% buffer around entries and exits, and we noticed a few things that can be improved.
- There are false positive trades during whipsaw periods where there is no clear trend, like in 2016.
- There are big drawdowns from the peak high price to our exit points (crossunder of the 200-daily SMA), wasting gains of the bull run, like in 2020.
We managed to reduce the whipsaw trades with some tricks and tweaks, but ultimately they are inevitable when the markets go sideways.
We love markets going up.
We are OK with markets going down, since we will exit.
We hate markets going sideways, since it increases costs and losses.
Weekly signals
The first differentiating aspect of my strategy is that it uses weekly candlestick charts and only executes trades using weekly close prices.
As mentioned in the previous section, we want to avoid whipsaw periods where we enter and exit trades close to each other without making much profit, if any at all. When this happens several times, losses are more likely than gains.
Using weekly charts reduces the amount of noise we have, and it also reduces the amount of trades we can do in a year. Note that we use 40-week SMA now instead of the 200-daily SMA, same total duration.
This change reduced the total number of trades, reduced the whipsaws, but also reduced the profits too.
Cross symbol strategy
Doing any technical analysis and signal detection on QQQ3 directly leads to noise and false positives, both for entries and exits, because each movement is significant.
We concluded that in this situation it’s better to use a less volatile symbol for detecting the signals, and use the more volatile but highly correlated symbol for the trade execution.
For example, the QQQ3 is the more volatile sibling of QQQ, so we detect signals on QQQ and execute on QQQ3.
Stop losses are calculated on the traded symbol, though, for proper risk management.
Moving Average Convergence and Divergence - MACD
Once we settled on using weekly signals, the next improvement comes from addressing the big drawdowns from the peak highs.
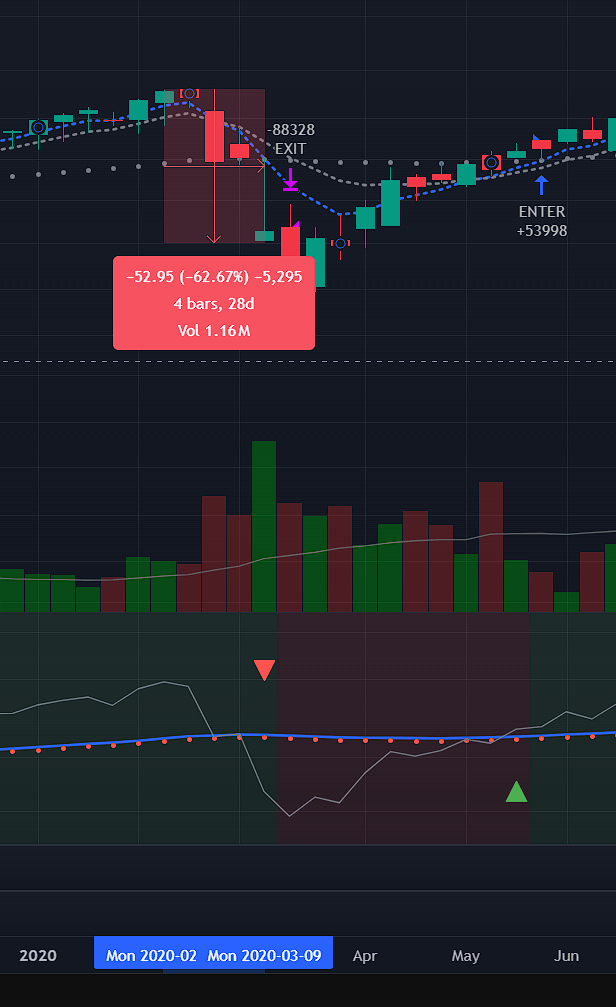
For example, even though the COVID crash of March 2020 was short in duration, it was a significant dip. The QQQ3 drawdown from peak high down to our exit when QQQ crosses under its 40W-SMA was roughly -60%.
We did many iterations and different variations of the SMA crossover approach with OK results. Tweaks and tricks here and there and employing different sub-strategies while above the 40-weekly SMA to capture more of the bull run. More details about some of these tricks might come in a separate article.
However, we decided to switch to using the weekly MACD indicator for our entry and exit signals, with tiny bit of tweaking to make it awesome.
Quoting directly from Investopedia’s MACD definition:
Moving average convergence/divergence (MACD) is a technical indicator to help investors identify price trends, measure trend momentum, and identify entry points for buying or selling. Moving average convergence/divergence (MACD) is a trend-following momentum indicator that shows the relationship between two exponential moving averages (EMAs) of a security’s price.
In a nutshell, the MACD indicator has two lines, the MACD line and the Signal line.
The MACD line is calculated using the Exponential Moving Average (EMA) of two periods:
MACD = 12-Period EMA − 26-Period EMA
The Signal line is calculated by taking the EMA of the MACD line:
Signal = MACD 9-Period EMA
When the MACD line crosses above the Signal line it means that the price is going up, they get close when the price moves sideways, and the MACD line crosses under the Signal line when the price is going down.
The key crossover for us is not between the MACD line and the Signal line, though, it’s between the MACD line and the zero line.
When the MACD line crosses over the zero line it means that now the 12-period EMA moves higher than the 26-period EMA, which most likely means a bull trend therefore we ENTER our position. When the MACD line cross under the zero line it means that the 12-period EMA moves lower than the 26-period EMA, indicating a bear trend therefore we EXIT our position.
The fact that we use weekly charts makes the MACD crossovers usable, otherwise there would be a lot of noise, even more than the simple crossover strategy we explored earlier.
Risk management with stop losses
Every successful professional trader and investor will tell you that the most important trait a trader should have is managing risks and sizing their positions appropriately.
There is an amazing talk by Dr. David Paul The Consistently Winning Trader Psychology where he explains, among other things, how to size your trades based on their risk.
Long story short, wisdom says you shouldn’t “bet or risk” more than 1-3% of your tradeable account value in each trade.
So, if the account has 100,000 USD, each trade should not risk losing more than 1-3K. What you choose exactly depends on your risk appetite and how confident you feel about your trades, so let’s settle on a 2% bet.
Note that the 2% bet, or 2K USD, is NOT the amount we should trade, it’s the max we could lose. The total amount of the trade depends on the strategy.
In my strategy we use a hard stop loss from the entry price at 10% (or 15% depending on how volatile is the traded symbol), so the total position we should enter comes out to 20K USD.
Position = AccountValue * RiskBet% / StopLoss%
=> 100_000 * 0.02 / 0.10
=> 20_000
The Nasdaq 100 makes moves larger than 10% regularly, and since we use 3x leveraged ETFs it means that a 3.4% movement from QQQ would instantly trigger our stop loss leading to false exits.
Therefore, the strategy uses dynamic stop losses on the way up. The stop loss from the entry price is a hard rule, and nothing overrides it.
However, during a bull trend, we use a trailing stop loss from the peak highs and allow up to 30% of drawdown, extended with some volatility buffer (fixed or ATR-based). This allows the 3x leveraged movements to have enough wiggle room to dip and then go up again, which is crucial to avoid false exits.
Concretely, the stop loss calculation is something like this:
stopLossPct = 10
stopLossDynamicPct = 30
bufferPct = 2

stopLossEntryPrice = entry_price * (1-stopLossPct/100)
dynamicStopLoss = highestClose * (1-stopLossDynamicPct/100) * (1-bufferPct/100)
activeStopLoss = math.max(stopLossEntryPrice, dynamicStopLoss)

shouldExitStopLoss = signalClose < activeStopLoss
Experienced folks will say that using leveraged ETFs is dangerous since they can move more than 30% in a single week.
Indeed, in theory this can happen. There is an optional escape hatch for emergency exits that we monitor manually. If the daily close price is lower than the calculated stop loss, then we can exit our position.
Better to lose some profits in case it was a false exit that recovers the next day, instead of not being able to sleep at night. We can always re-enter the position if it’s going up (see below).
Re-entry after a stop loss trigger
There are two main rules for an entering a position:
- MACD line crosses over the zero line.
- MACD line crosses over the Signal line, used only when the MACD line is above the zero line.
The first rule is used after we exit because of a bear market where the MACD line crossed under the zero line.
The second rule is used after we exited due to a stop loss while the MACD line is still above the zero line. This can happen when there are big drops but the market recovers before crossing under the zero line.
The benefit of the MACD-based strategy over the SMA-based strategy is that eventually the MACD line always crosses the MACD Signal line, even if they stay above the zero line. Prices do not always go up, at some point they will stabilise and the MACD line converges with the Signal line, leading to a crossover.
This allows us to use stop losses and protect ourselves.
Tricks and tweaks
The strategy also incorporates a few tweaks and tricks that become possible due to the fact we use different symbols for signal and execution, further optimizing our entries and exits to avoid false positives.
As we will see later in the backtesting section, this same strategy can be used with company stocks as well, like AVGO (Broadcom) or SMT (Scottish Mortgage Trust). The main requirement is that these stocks are very highly correlated with the signal symbol, in this case Nasdaq 100 (which is configurable too).
We won’t go into details for these tweaks but just to give a glimpse:
- Relative strength. When entering a position the target symbol (QQQ3, AVGO) has to be trending upwards faster than the signal symbol (QQQ).
- Rising or Falling. When entering or exiting a position the target symbol must be in the appropriate trend as well for N consecutive weeks. For example, enter only once there are 2 rising bars.
- Buffer around the exit level to avoid false exits and whipsaws (sudden move down, then immediately up).
- For the MACD Signal line calculation we use a 5-period EMA instead of 9-period EMA. Falls into the overfitting category, but it does give a slight edge to some trades recovering faster from dip drawdowns, without any drawback. You can use the 9-period EMA, though, and the overall results will be similar.
- … few more.
All of the above are configurable and optional.
Keep in mind that these tricks can be incorporated in any strategy, even the 200-daily/40-weekly SMA crossover strategy. We did actually implement most of these for that strategy too, but the MACD-based strategy is still overall better.
Backtesting
OK, let’s see some numbers!
- All charts below are logarithmic scale, so that the past dips are not miniscule.
- Click each image to see it in full size.
Chart legend
The screenshots below have a panel for the active strategy right below the chart itself.
The strategy panel has certain icons that is worth knowing what they mean:
- Green triangle: All conditions are met for an entry.
- Red triangle: All conditions are met for an exit.
- Red flag above red triangle: Exit triggerred because of a stop loss.
- White cross overlay the red triangle: The trade ended up losing money.
- Yellow triangle: MACD line crosses below the exit level, but we are waiting for the confirmation filters.
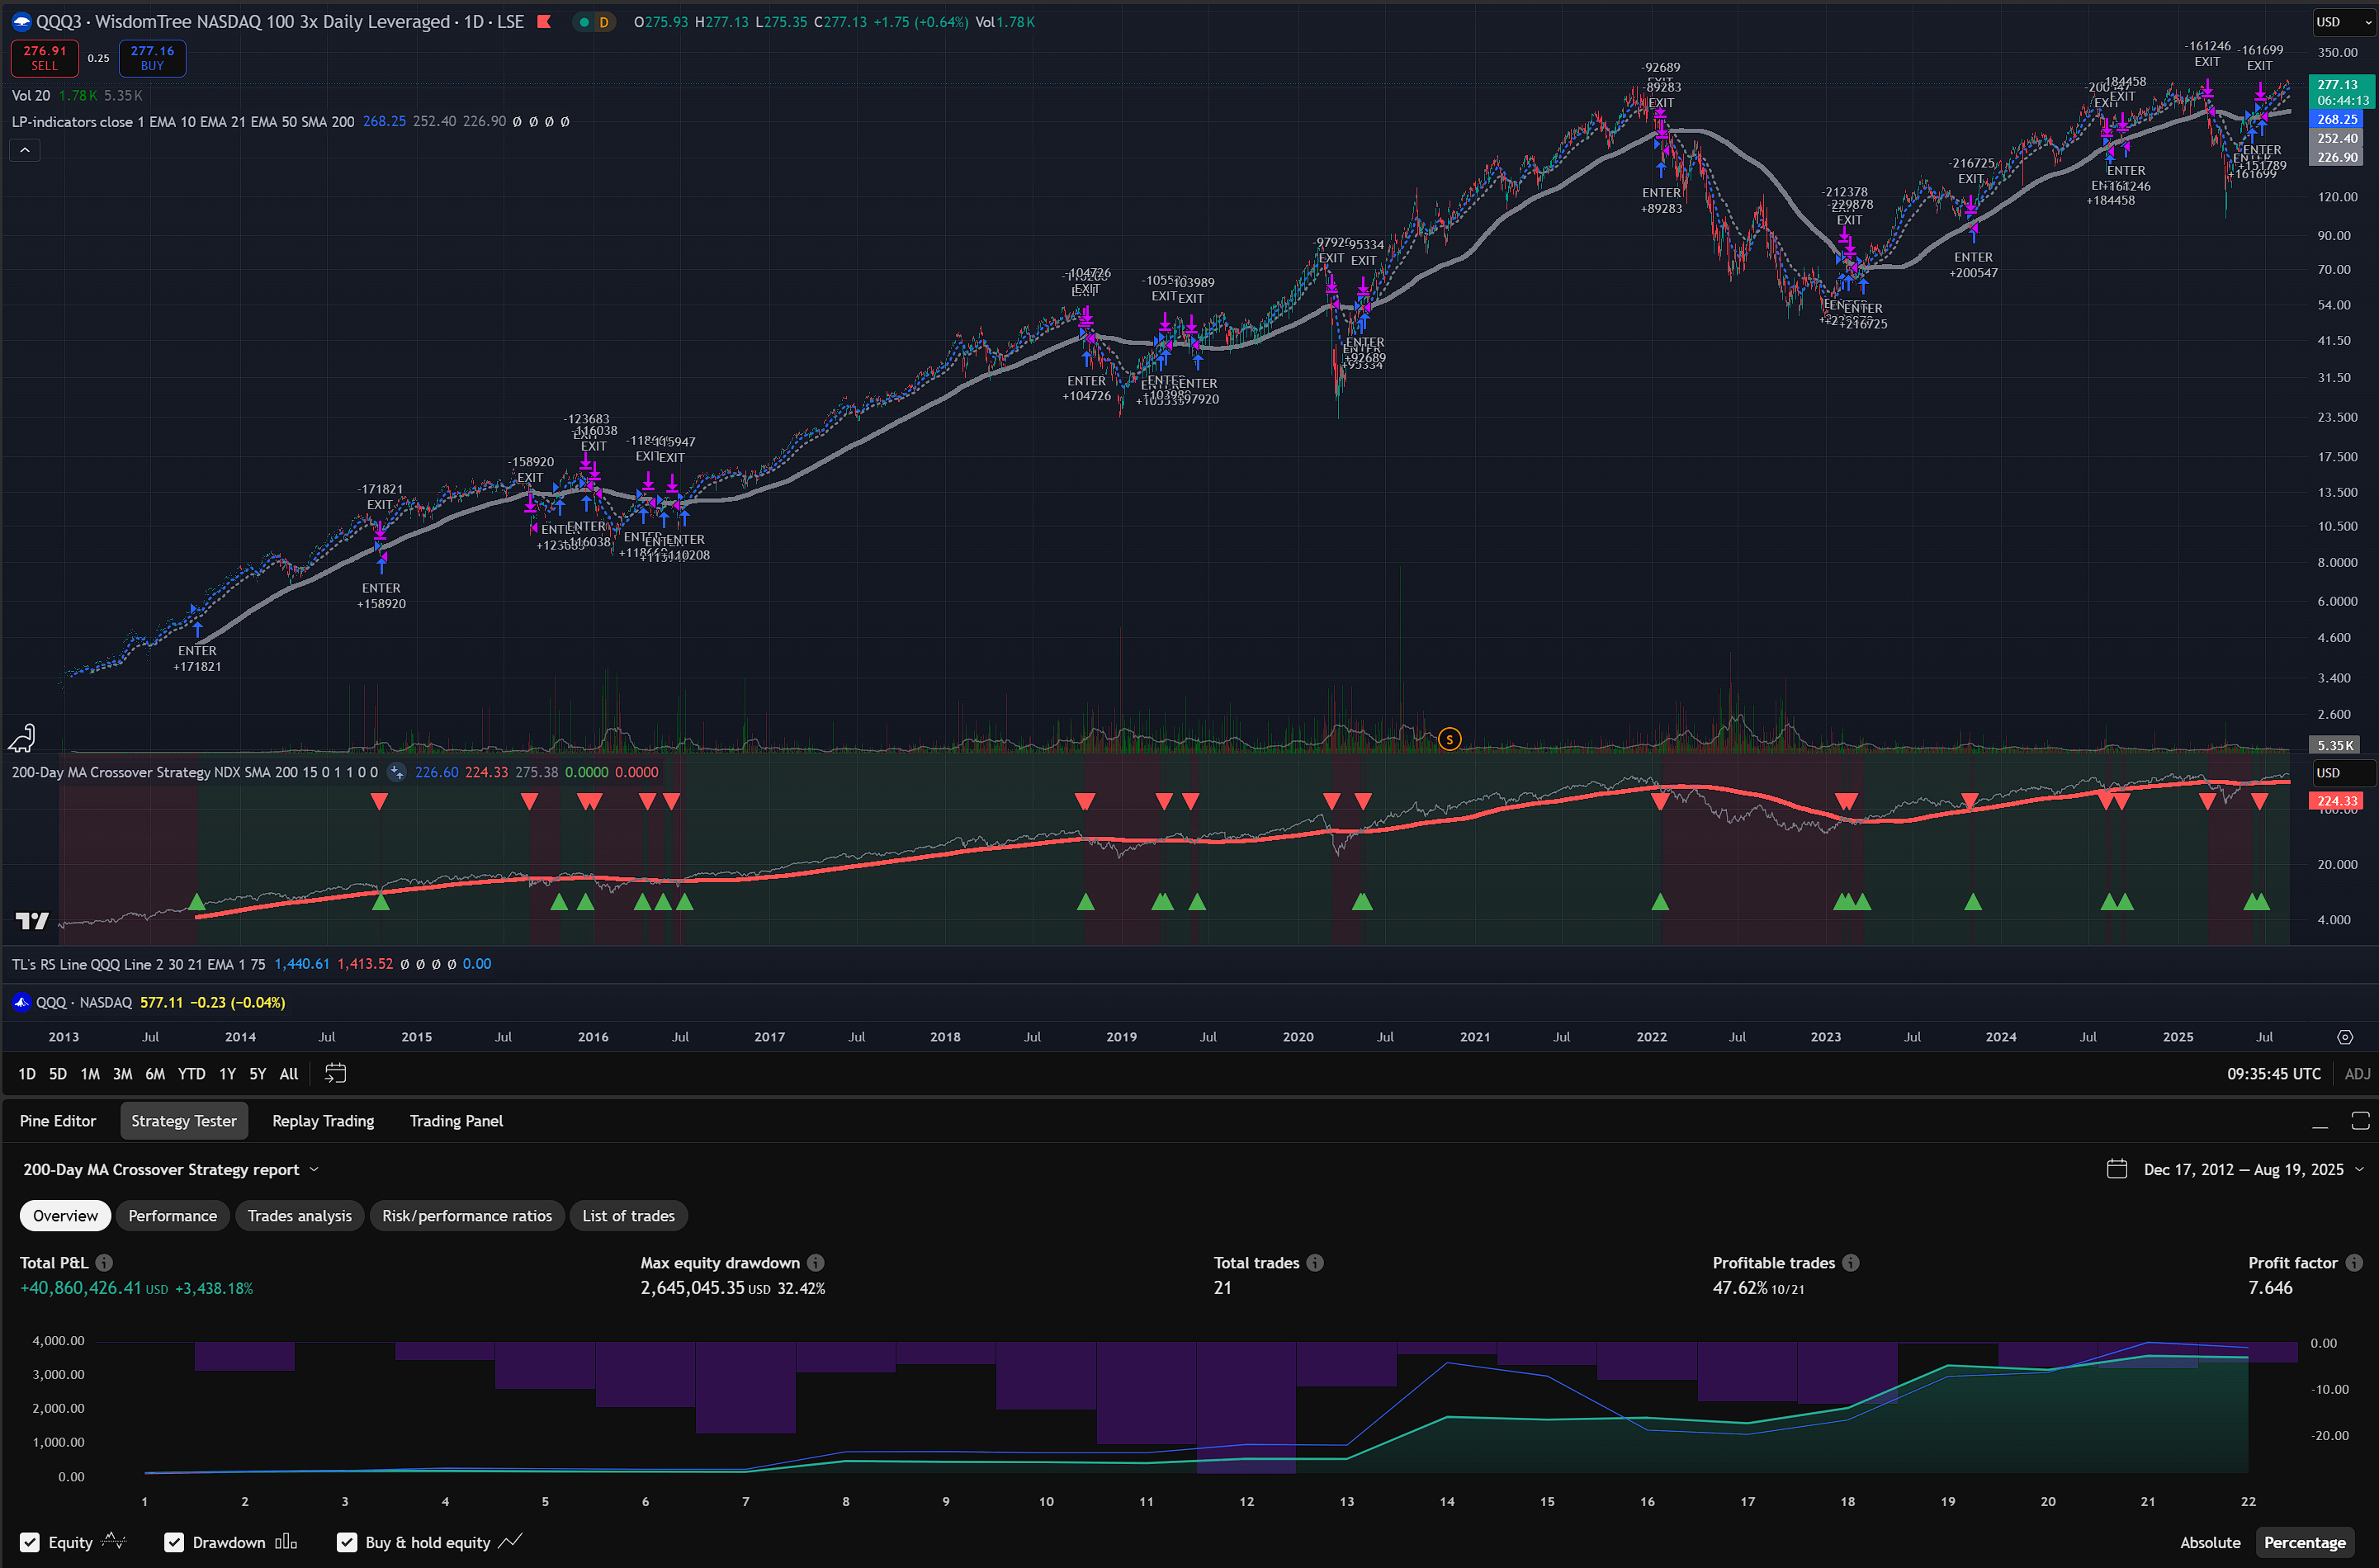
QQQ3 with QQQ signal
- Dates: 2012-12-01 to 2025-07-31
- Configuration:
BufferPct=2% - Results: +10,981% PROFIT
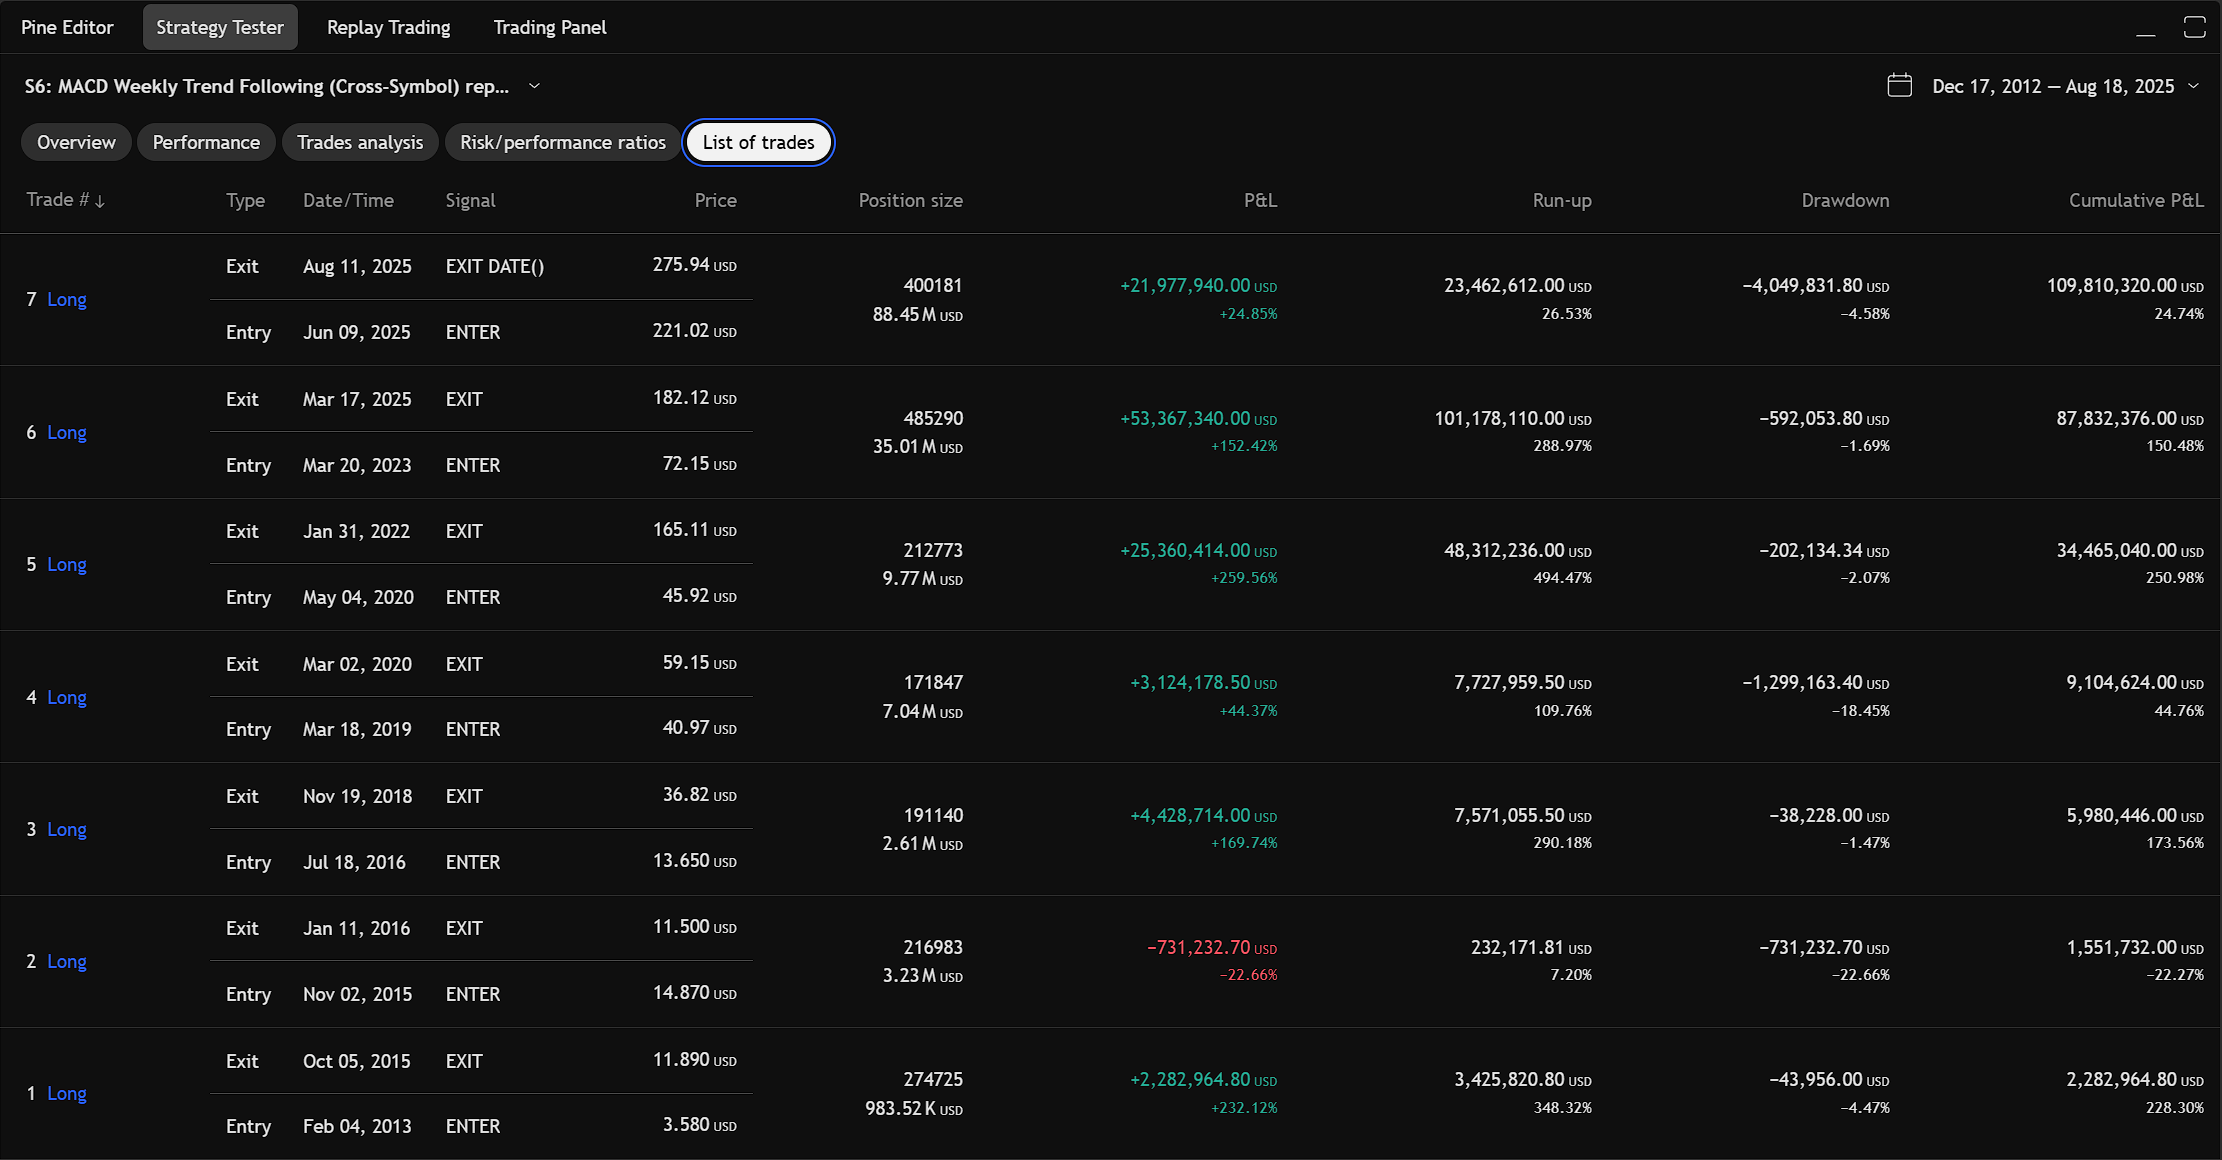
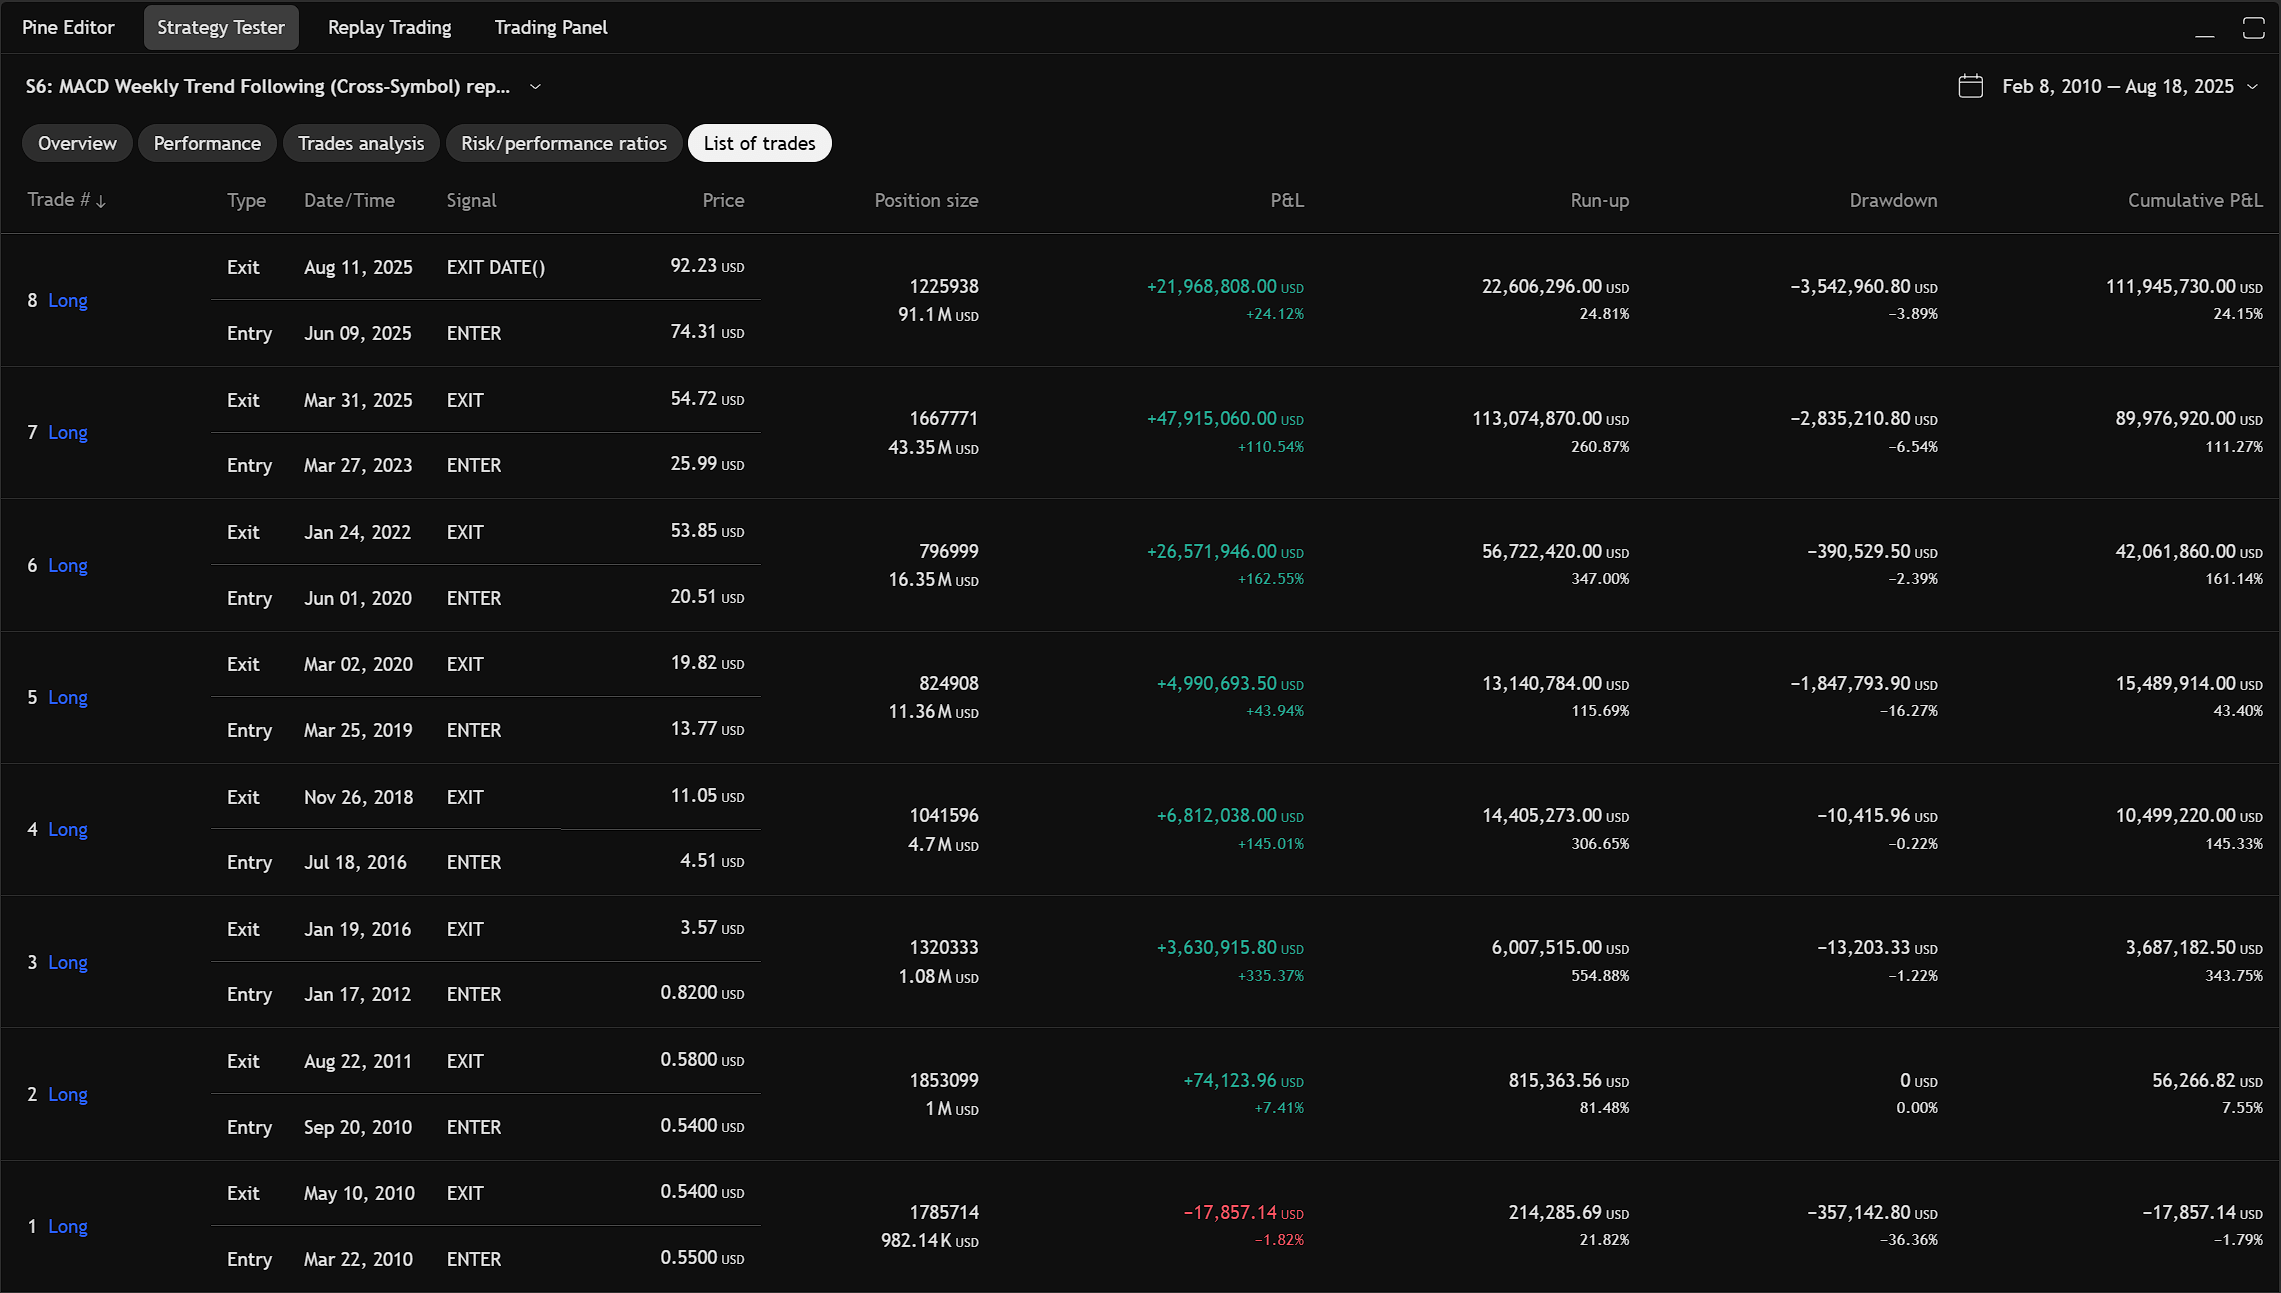
And the individual trades.
And this is how the 40-week SMA crossover strategy would behave when using NDX as the signal symbol (with the 2% exit buffer too). +2,800% PROFIT
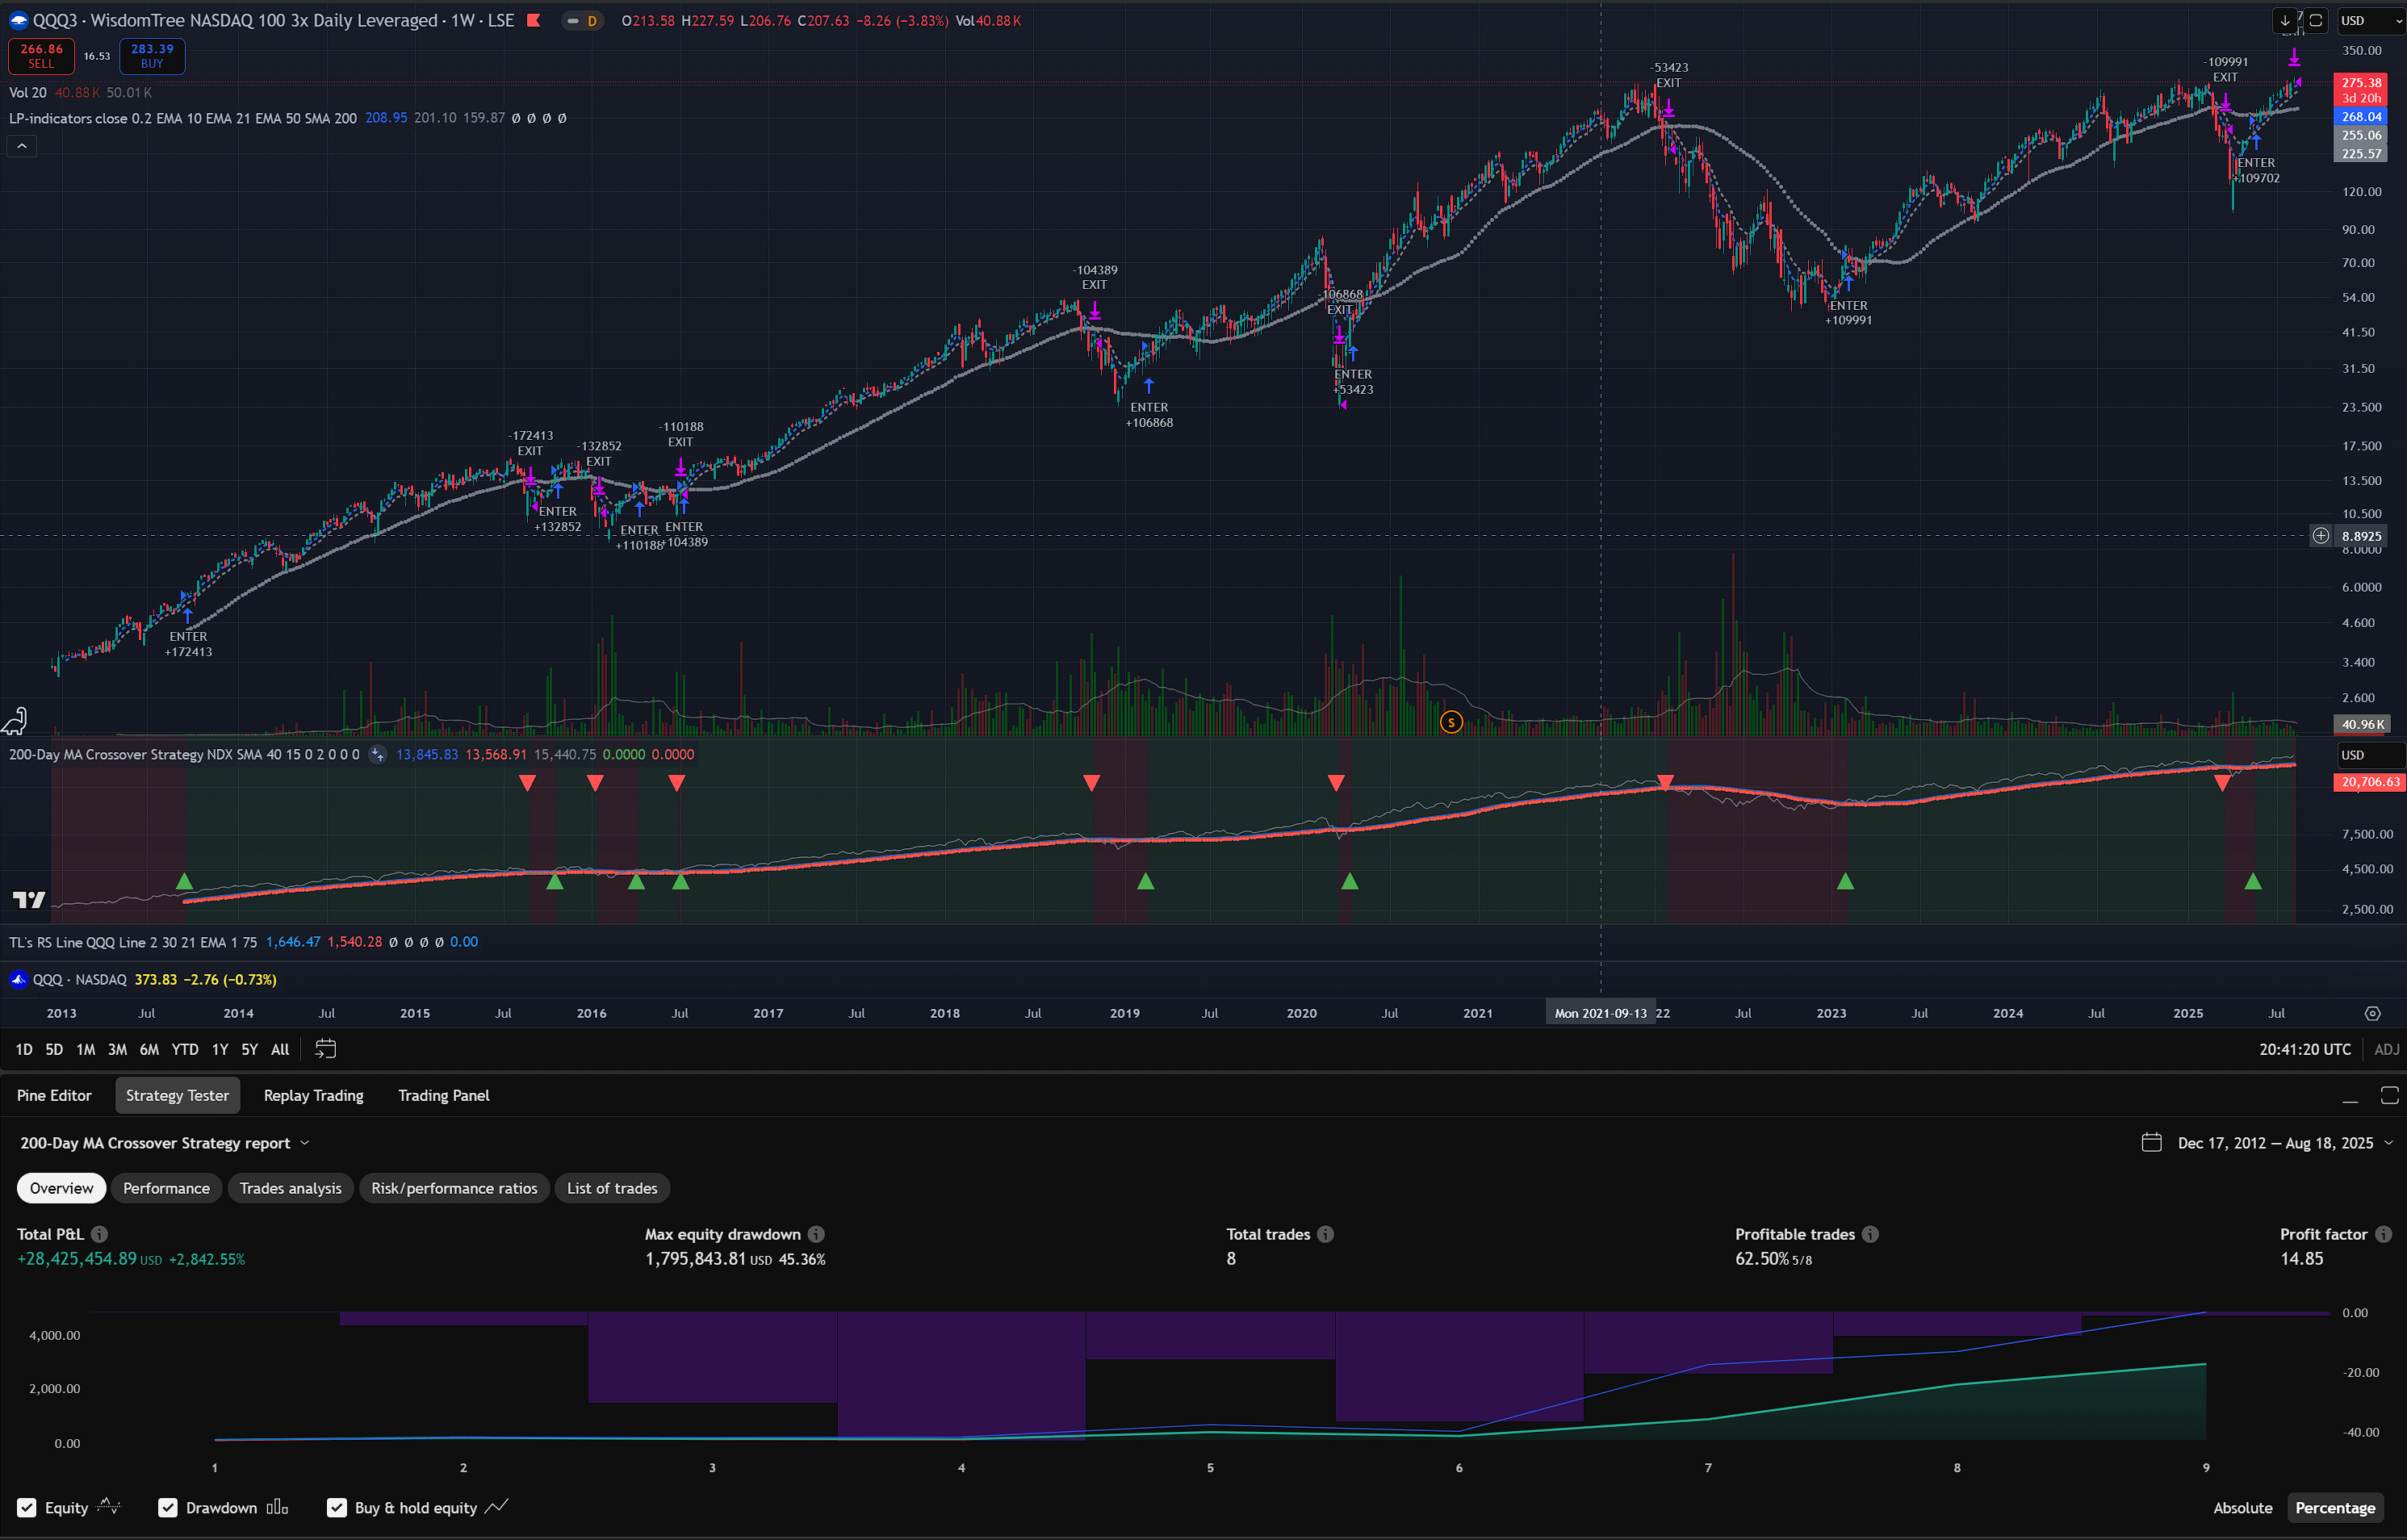
Using the QQQ3 as signal with the 40-week SMA crossover strategy returns +2,300% PROFIT.
QQQ3 with NDX signal
- Dates: 2012-12-01 to 2025-07-31
- Configuration:
BufferPct=2% - Results: +12,698% PROFIT
NDX is the Nasdaq 100 index itself, whereas QQQ is an ETF tracking the index. As you see the performance is almost identical to the one using QQQ as signal, just a single trade in 2016 moves a bit earlier when using NDX as the signal symbol leading to a bit of extra profit.
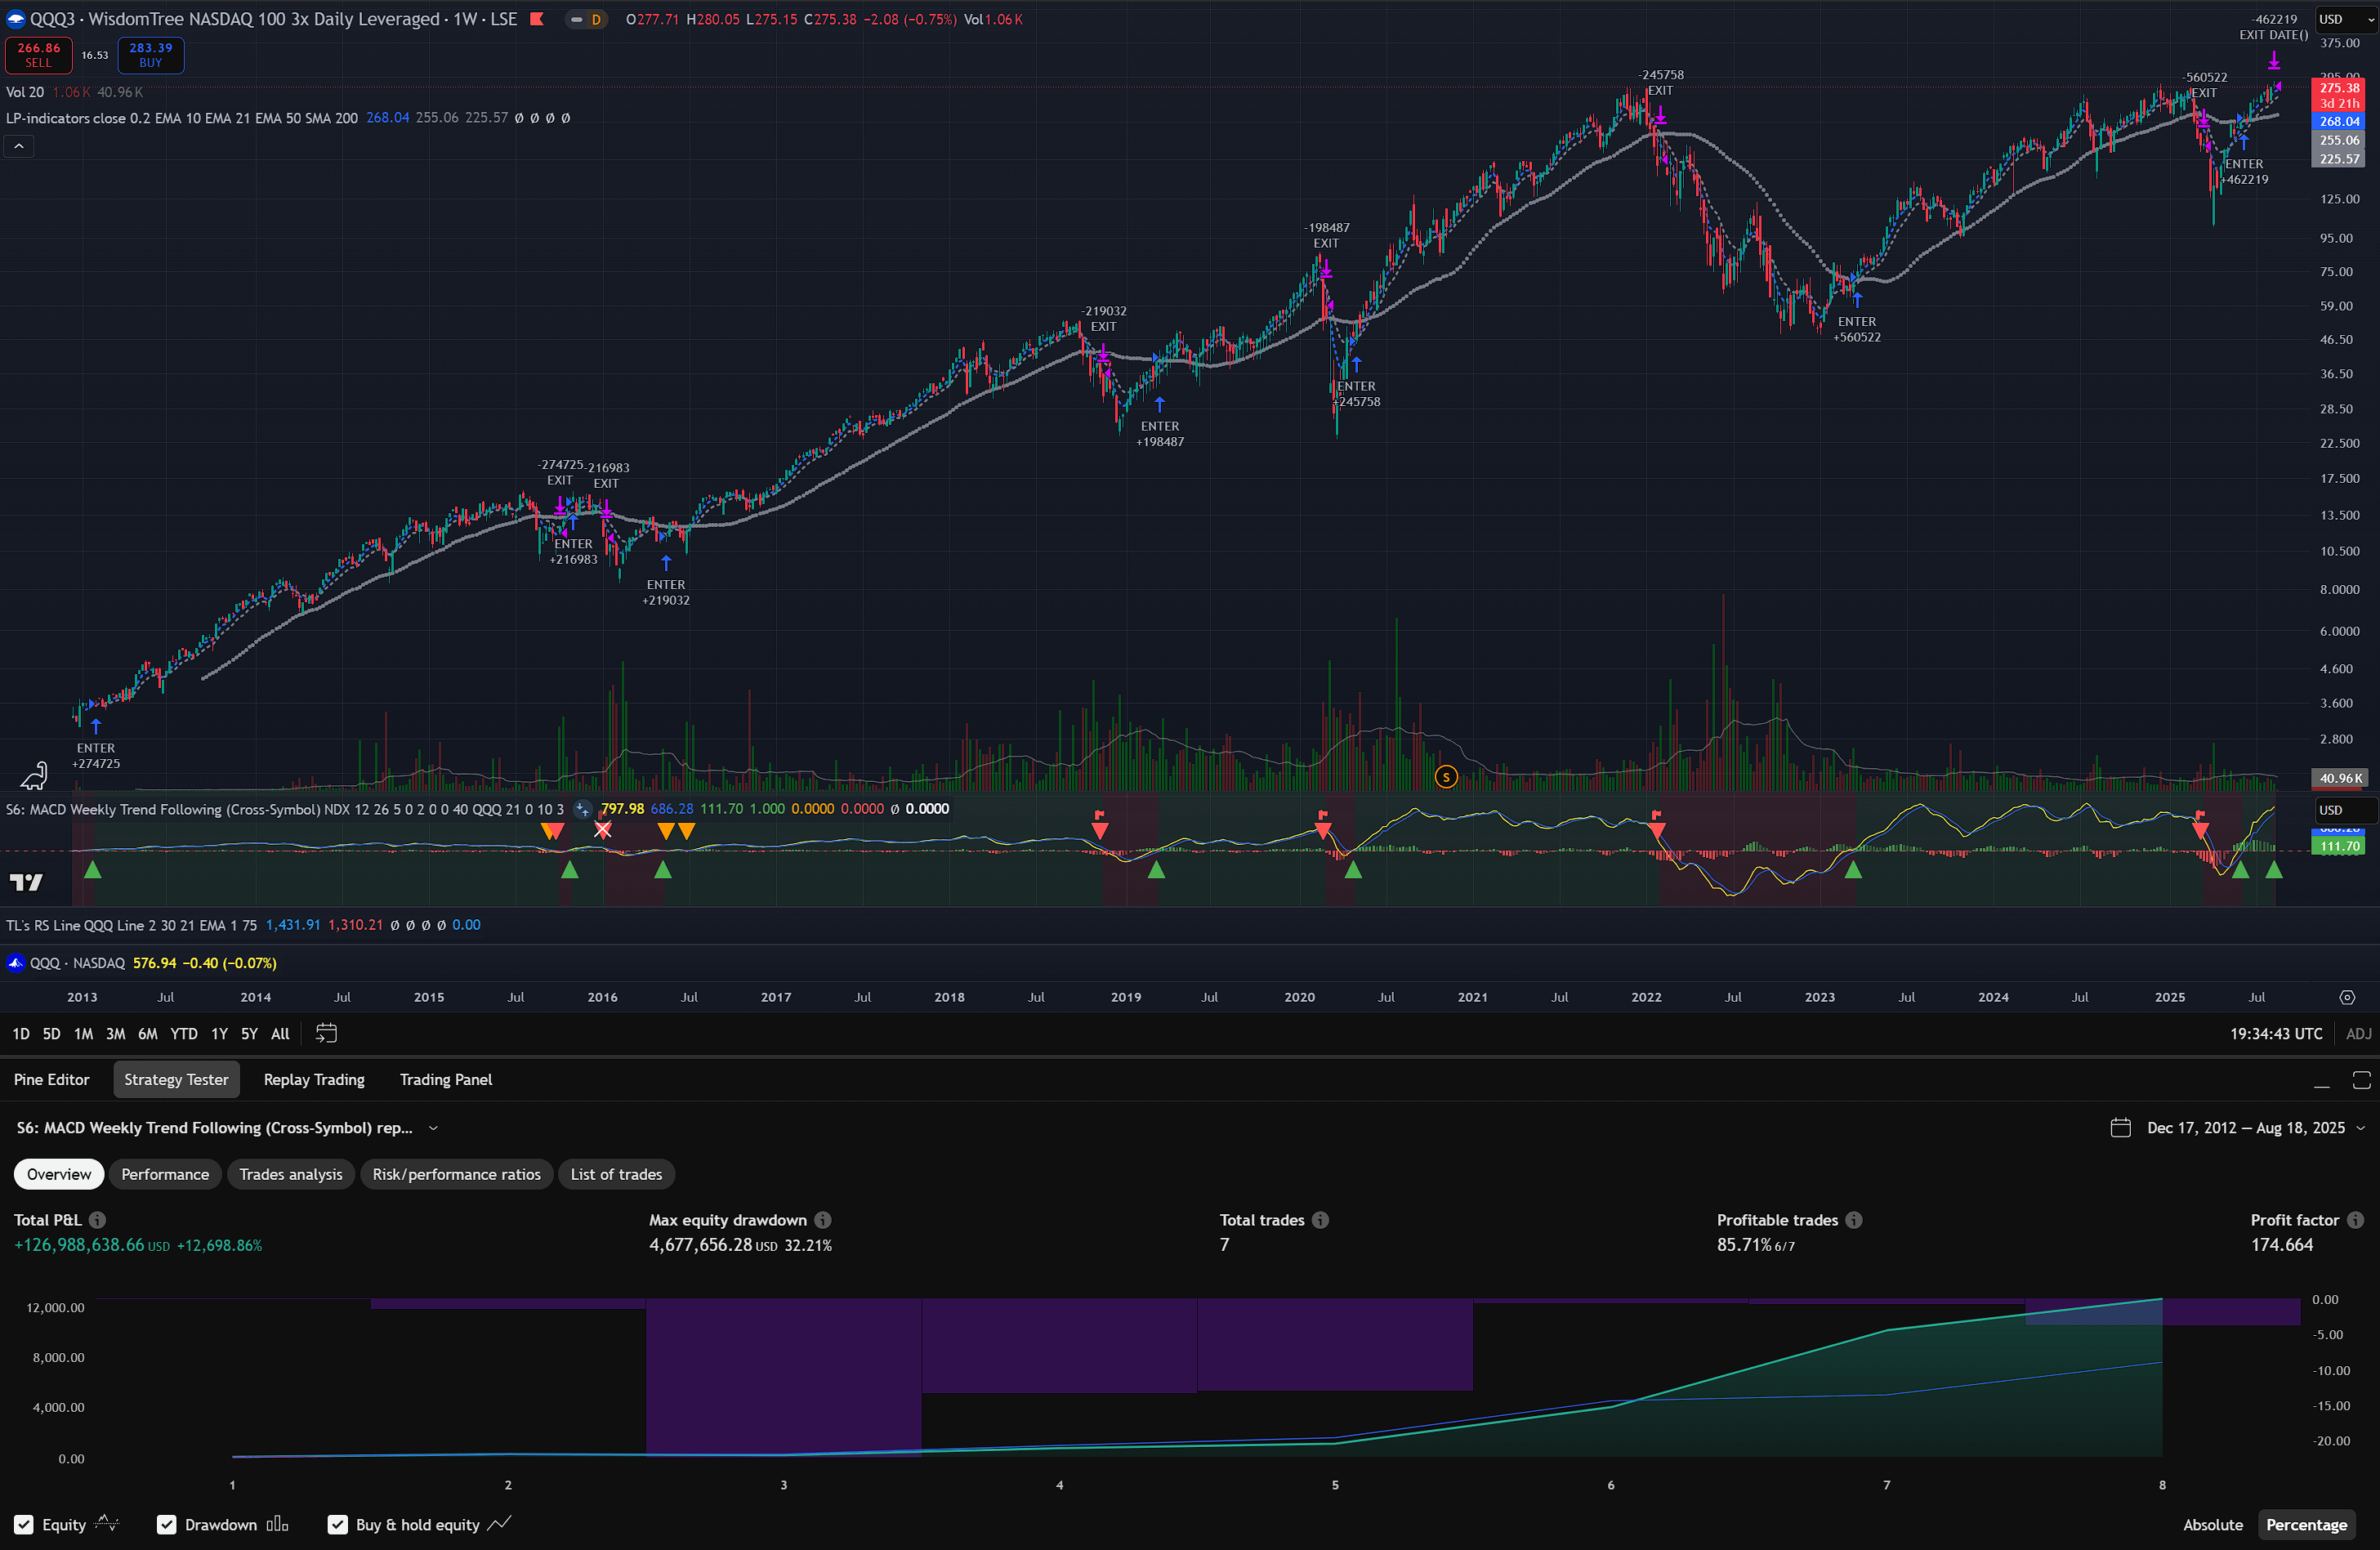
These small differences are insignificant at the grand scheme of things, and focusing too much on these just leads to overfitting the strategy which can lead to bad results in the future.
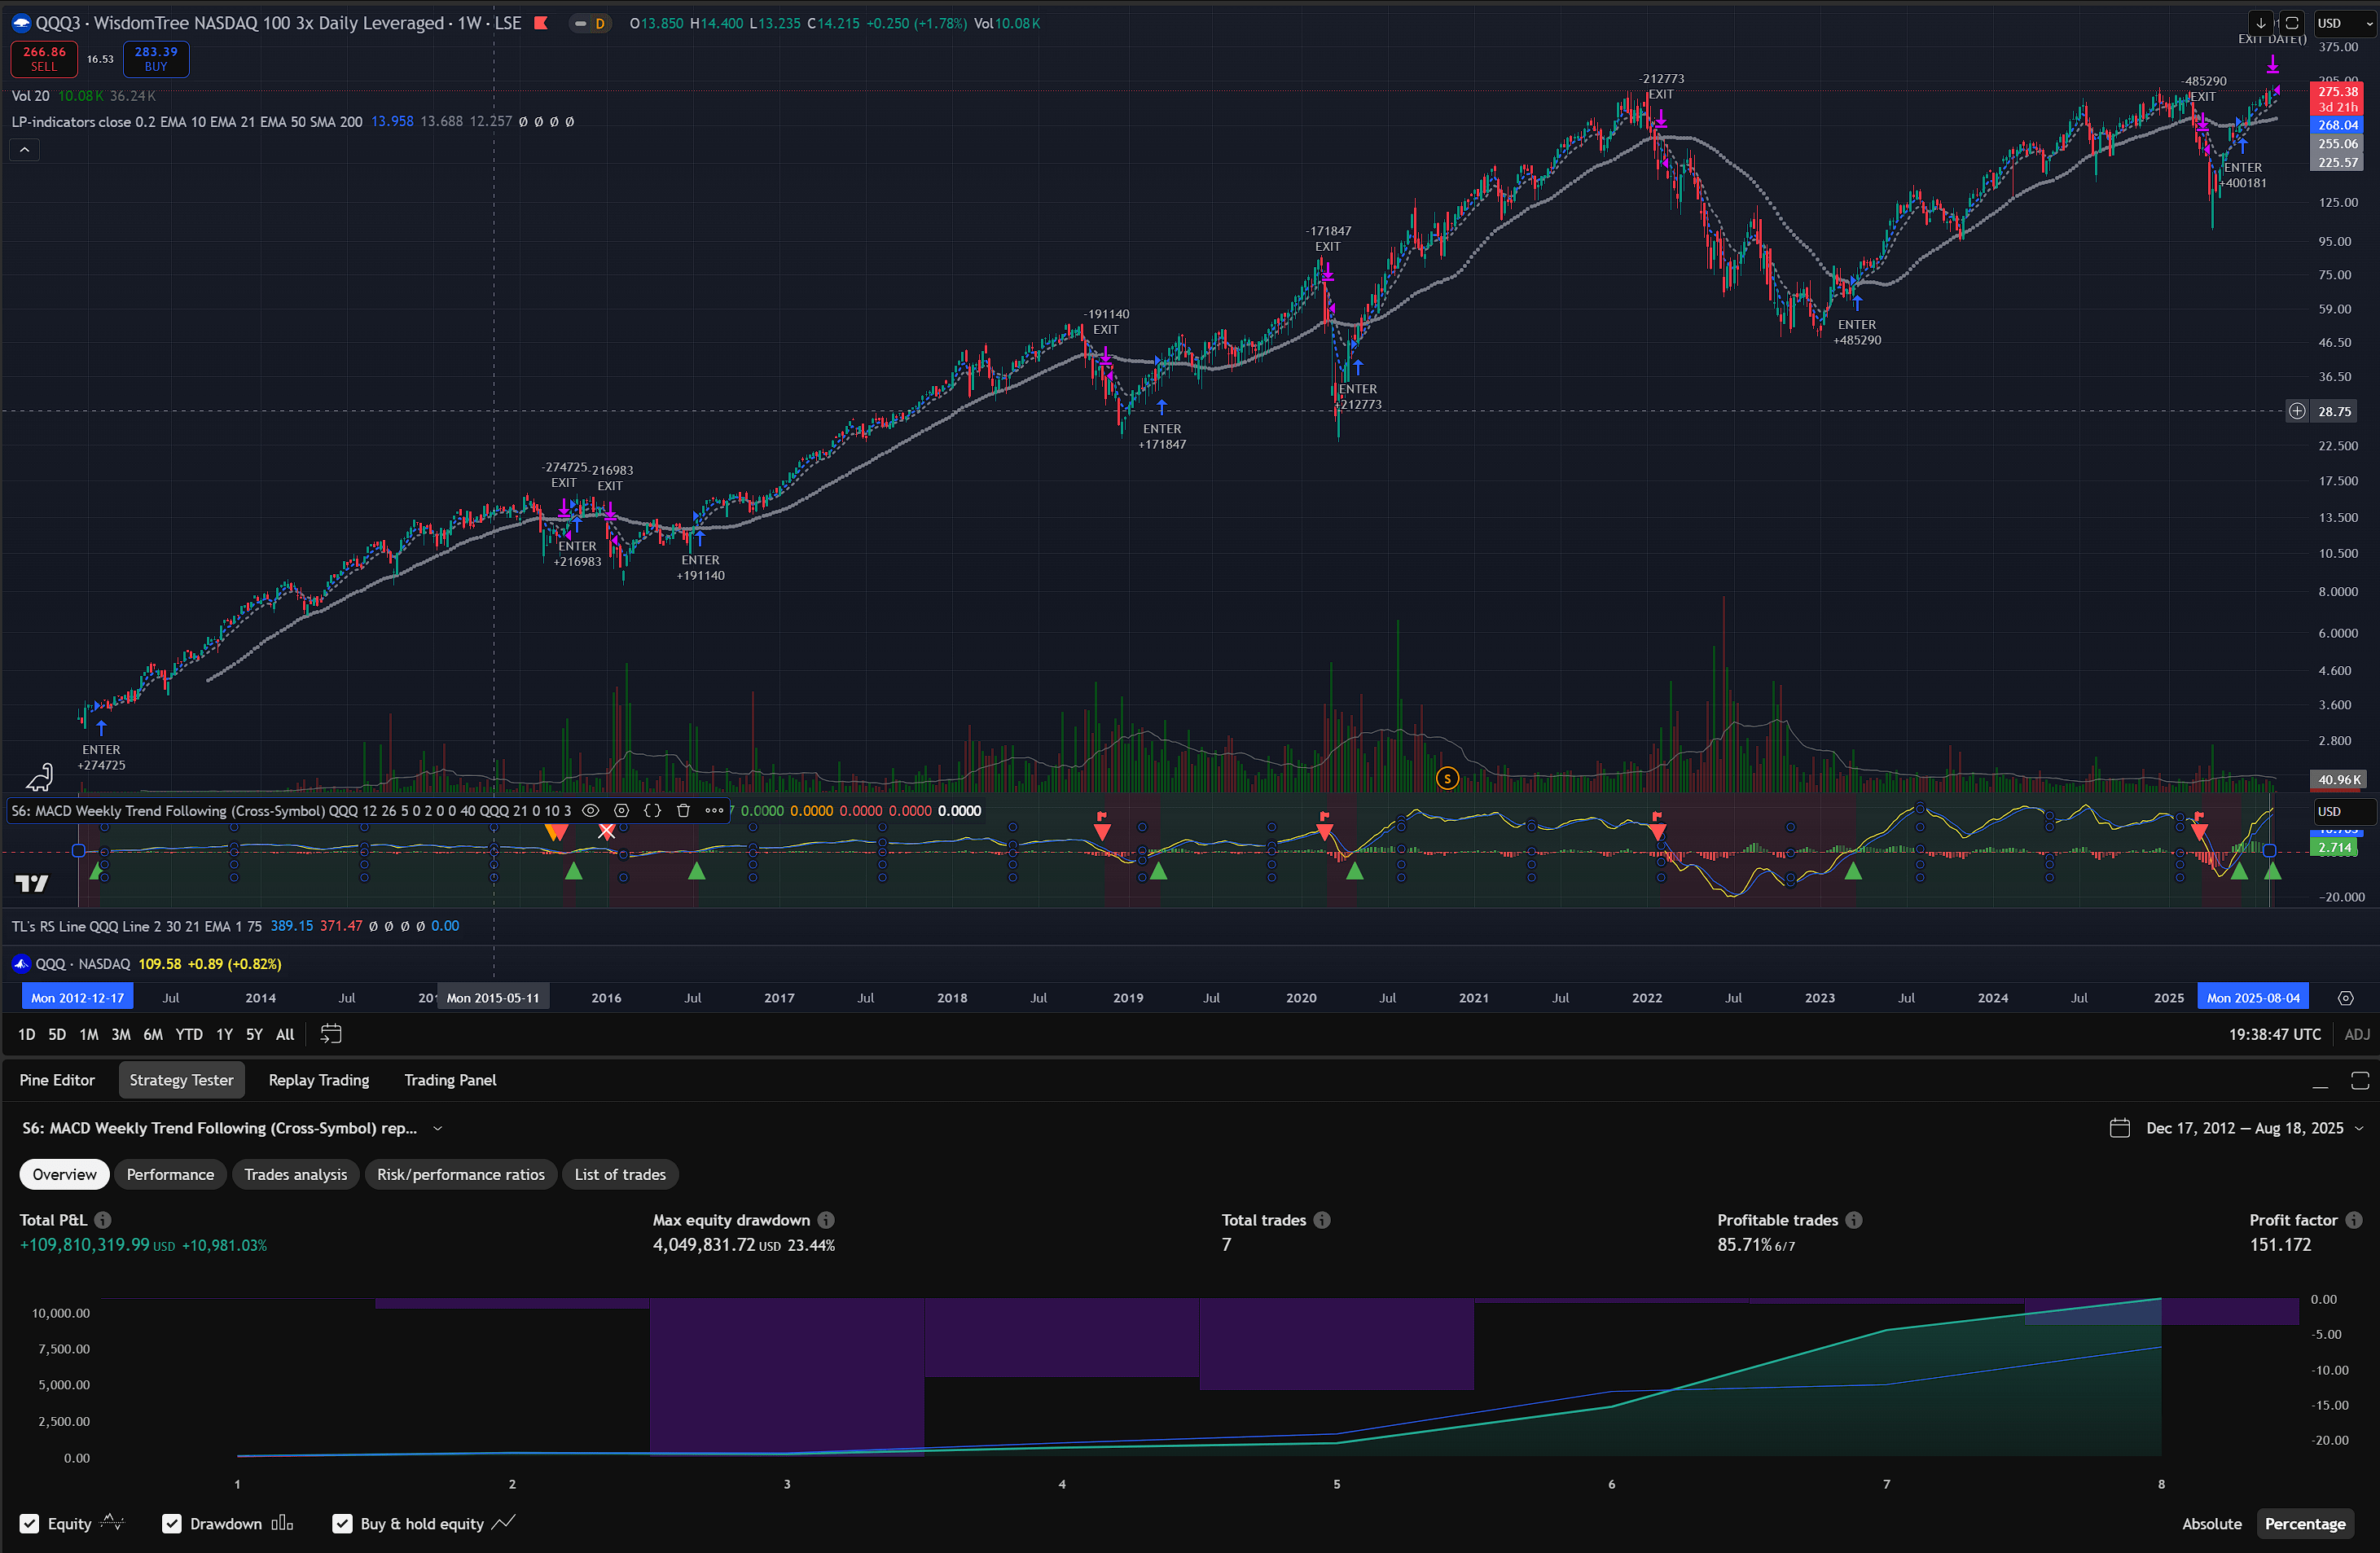
TQQQ with QQQ signal
TQQQ is the US version of QQQ3, and the strategy works nicely as well.
- Dates: 2010-02-08 to 2025-07-31
- Configuration:
BufferPct=2%, ConsecutiveEnterConditions=2 - Results: +11,194% PROFIT
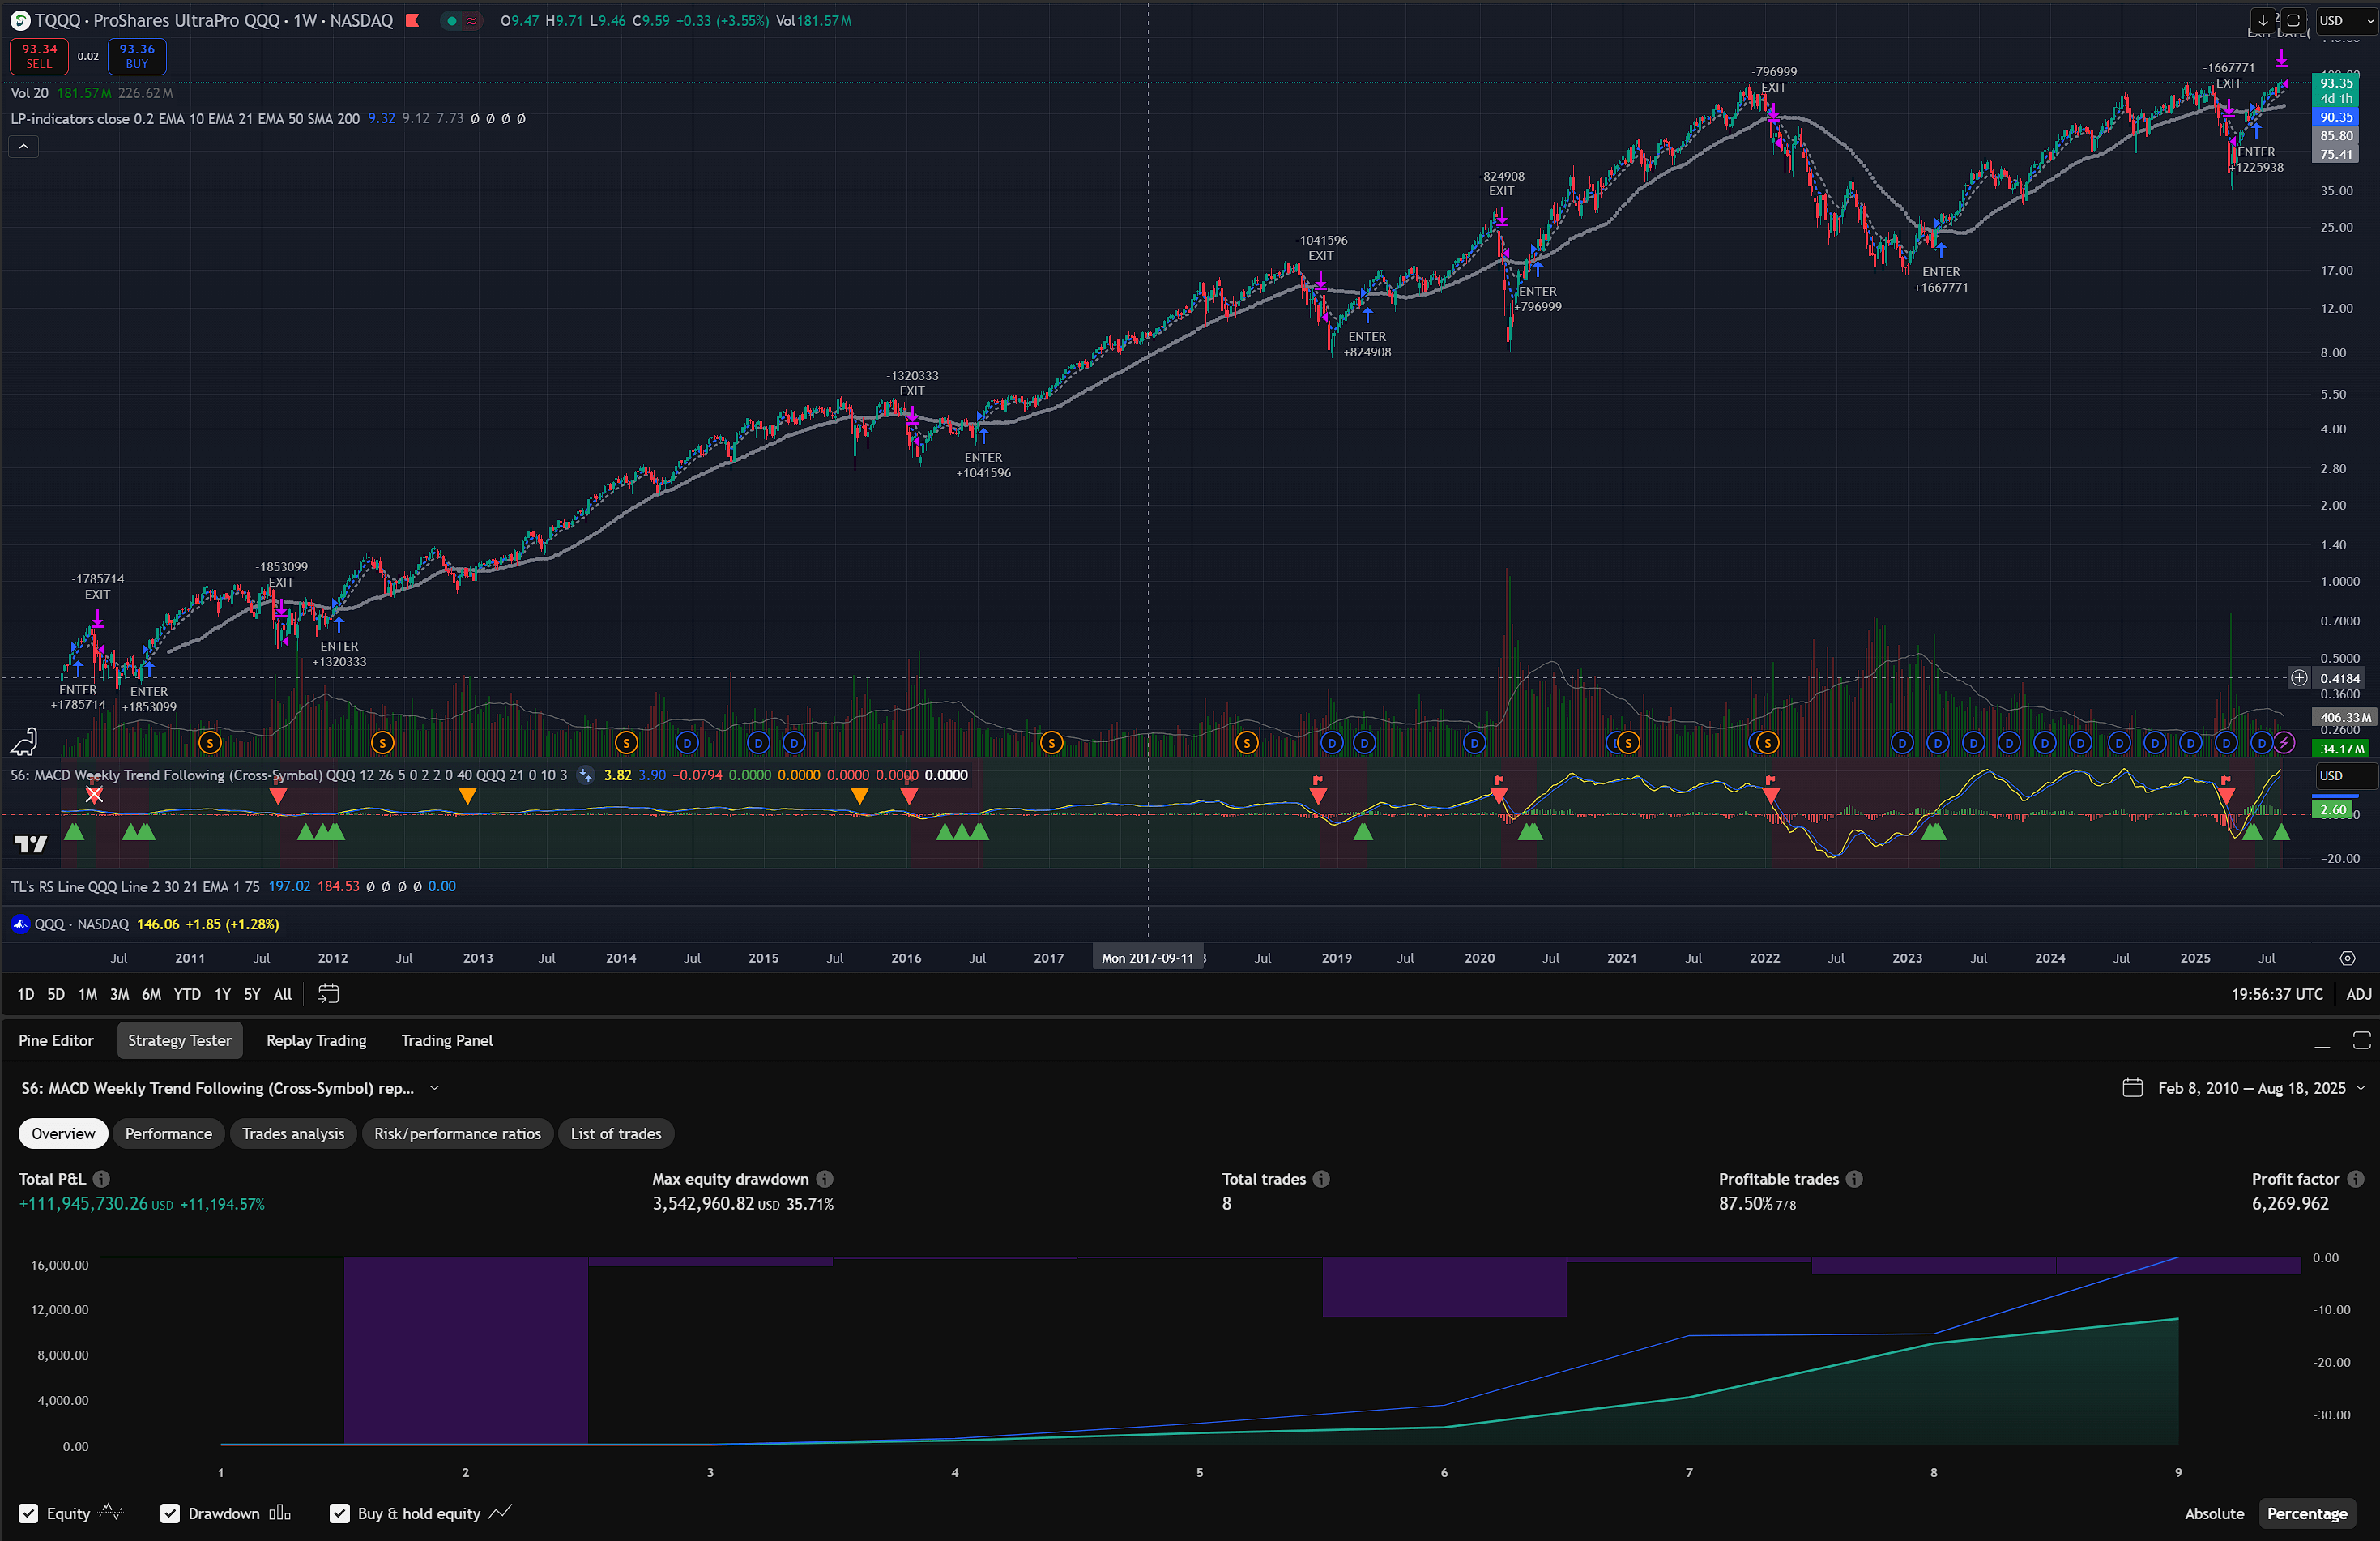
And the individual trades.
EQQQ with NDX signal
EQQQ is the UCITS compliant version of QQQ tradeable in Europe. This comparison is mostly to show the behavior during market crashes, since EQQQ is in theory tracking NDX, although currency fluctuations can have an impact here too.
- Dates: 2005-08-01 to 2025-07-31
- Configuration:
BufferPct=2%, RelativeStrengthBars=1 - Results: +1,100% PROFIT
Notice how the strategy handles the drawdowns of 2008-2009 and 2022 very nicely. In the end, the strategy underperformed slightly the buy and hold from 2005, but the whole benefit of using this strategy is that the drawdowns we experienced were almost nothing and the single losing trade in 2008 was just a -11%.
This is why I like this strategy. Avoid holding the bag at the bottom, but capturing the meat of the bull. OK, it got too buzzwordy.
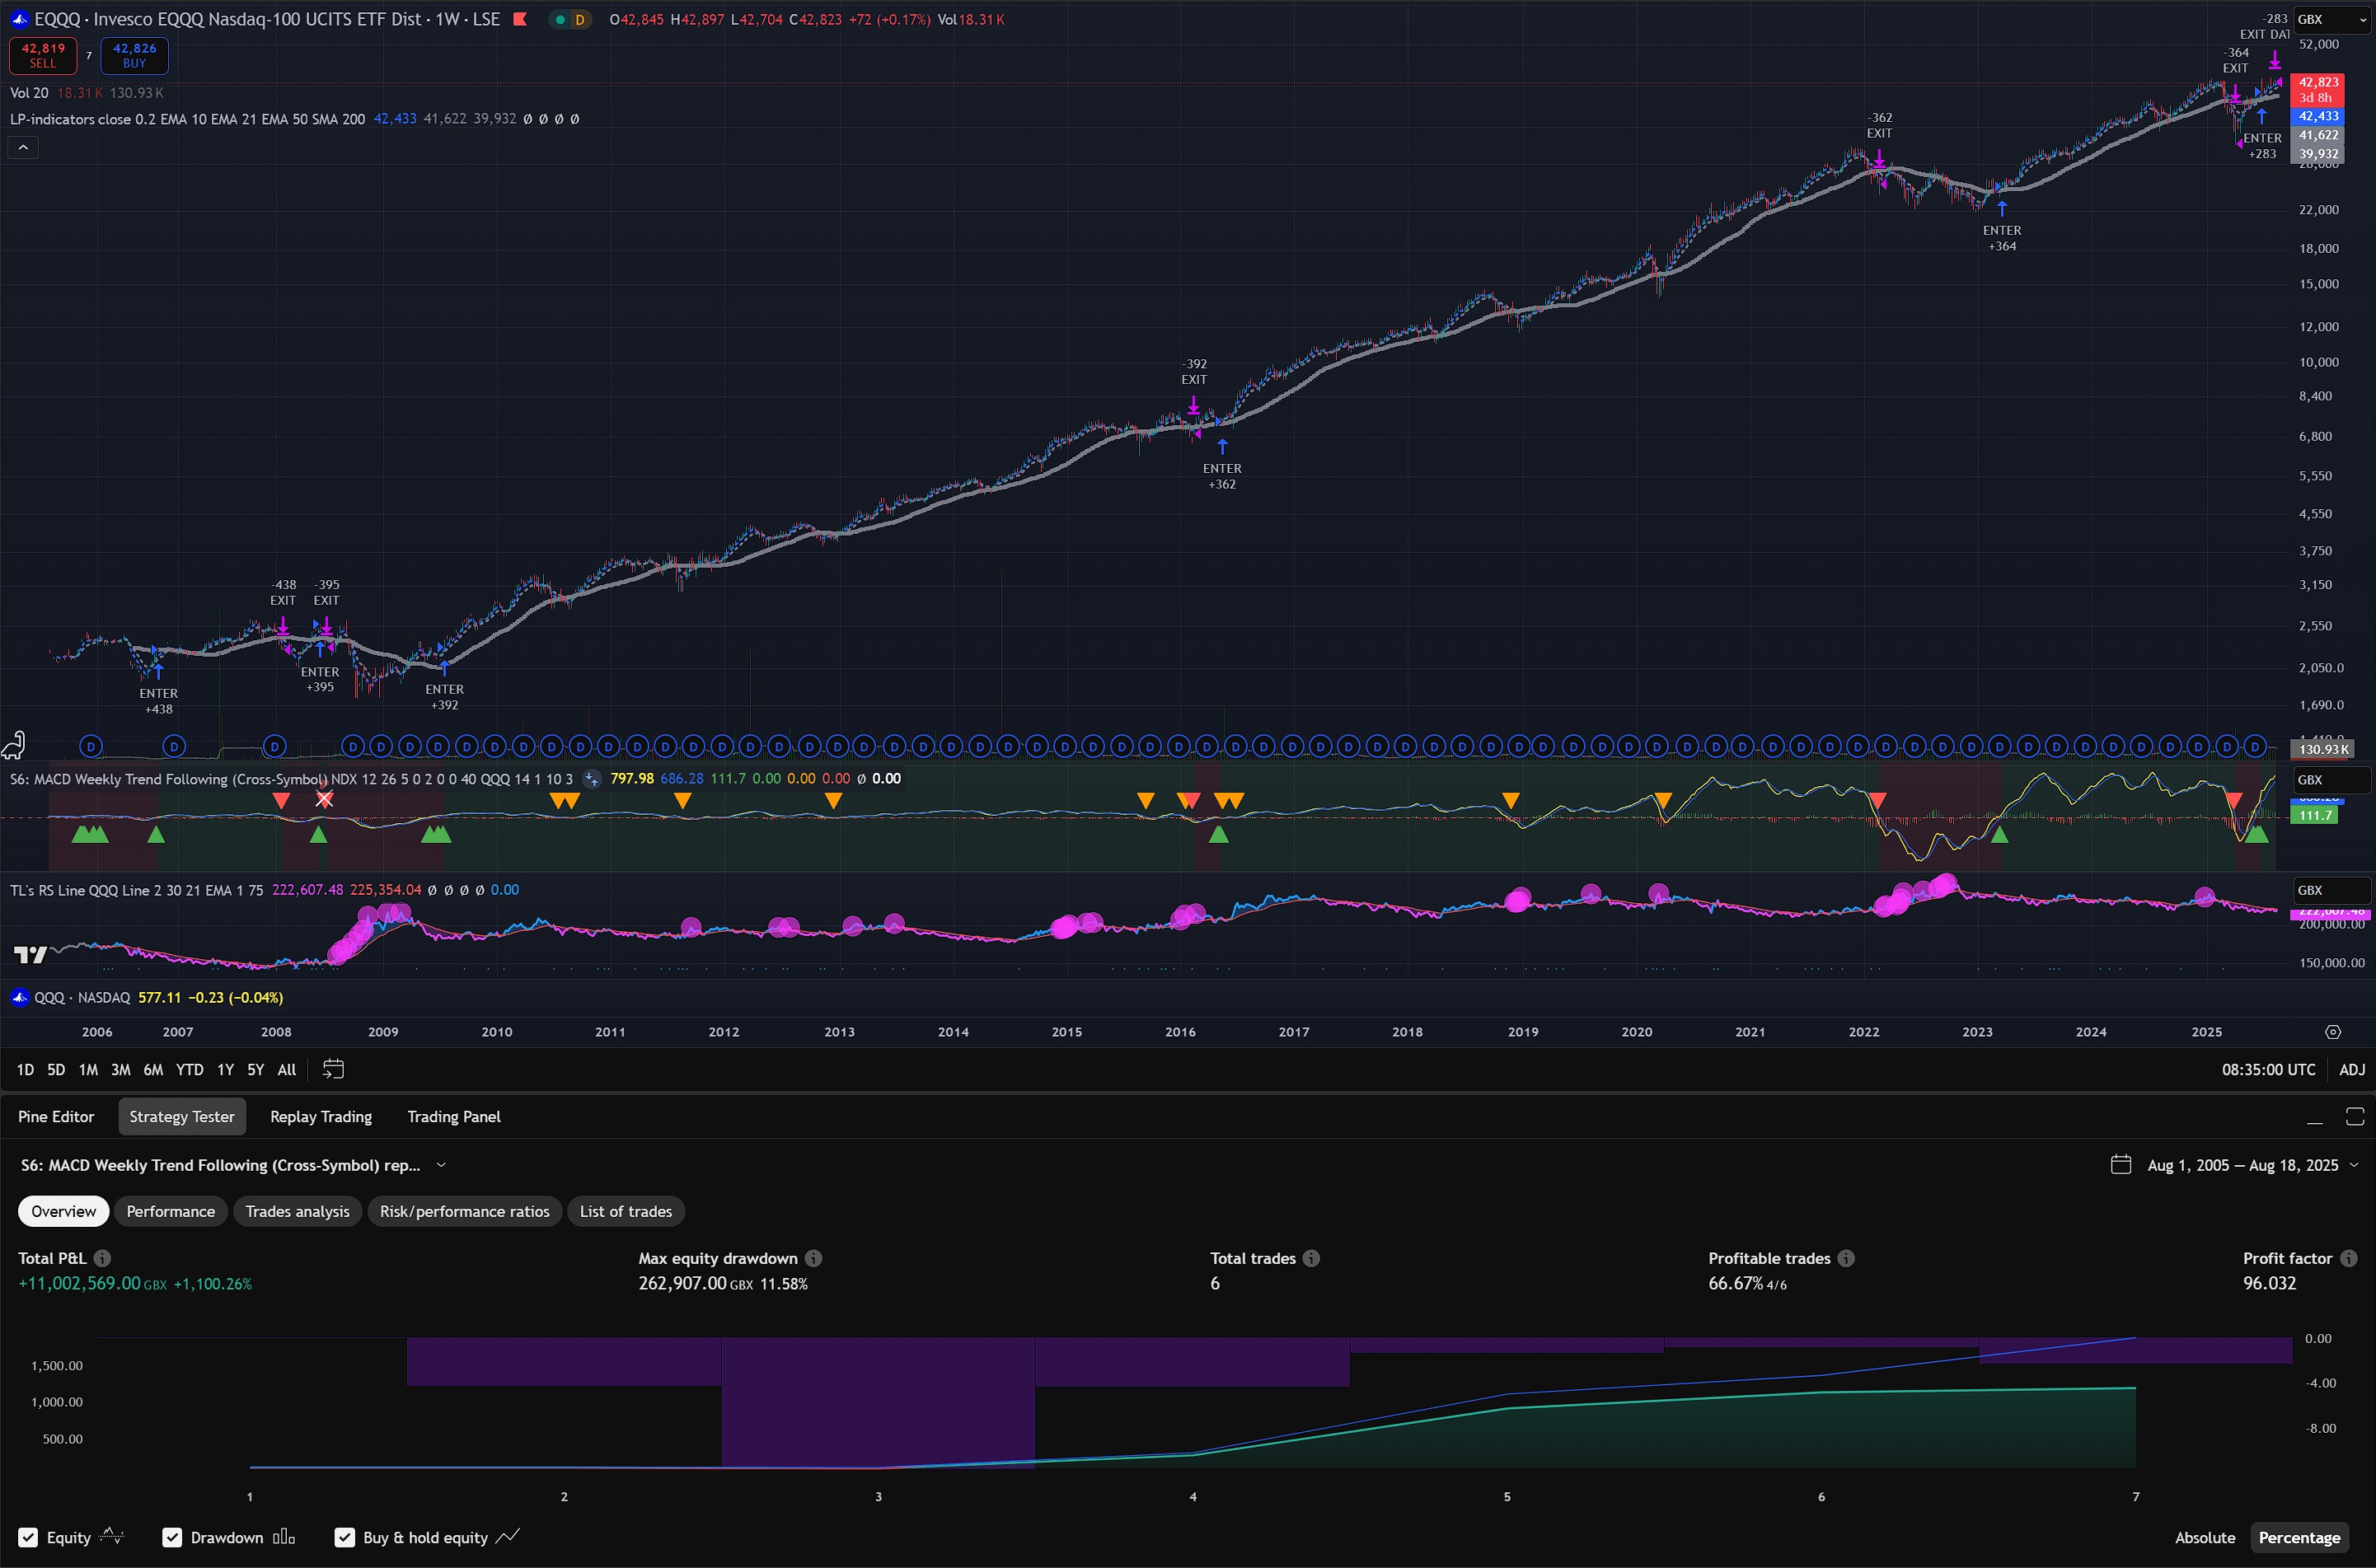
The purple chart (3rd top to bottom) shows the relative strength of EQQQ against the Nasdaq 100 Index (NDX). When the line is purple EQQQ is weaker than NDX, therefore it does not enter a position (see the green triangles until mid-2001), and when the line is blue EQQQ is stronger than NDX and positions can be entered.
Scottish Mortgage Trust (SMT) with QQQ signal
Scottish Mortgage Trust is a growth focused trust in the UK, which I usually invest in for global growth exposure.
Here we also use the relative strength filter as entry confirmation, since occasionally QQQ will be trending upwards while SMT downwards, and that is not a good time to enter.
In this case, we can see the strategy working throughout the crashes of the past 25 years, including the dotcom bubble in 2000, the crash of 2008, COVID crash in 2020, and the longer crash in 2022.
- Dates: 1995-07-24 to 2025-07-31
- Configuration:
BufferPct=2%, RelativeStrengthBars=1 - Results: +1,305% PROFIT and we avoided most of the big dips.
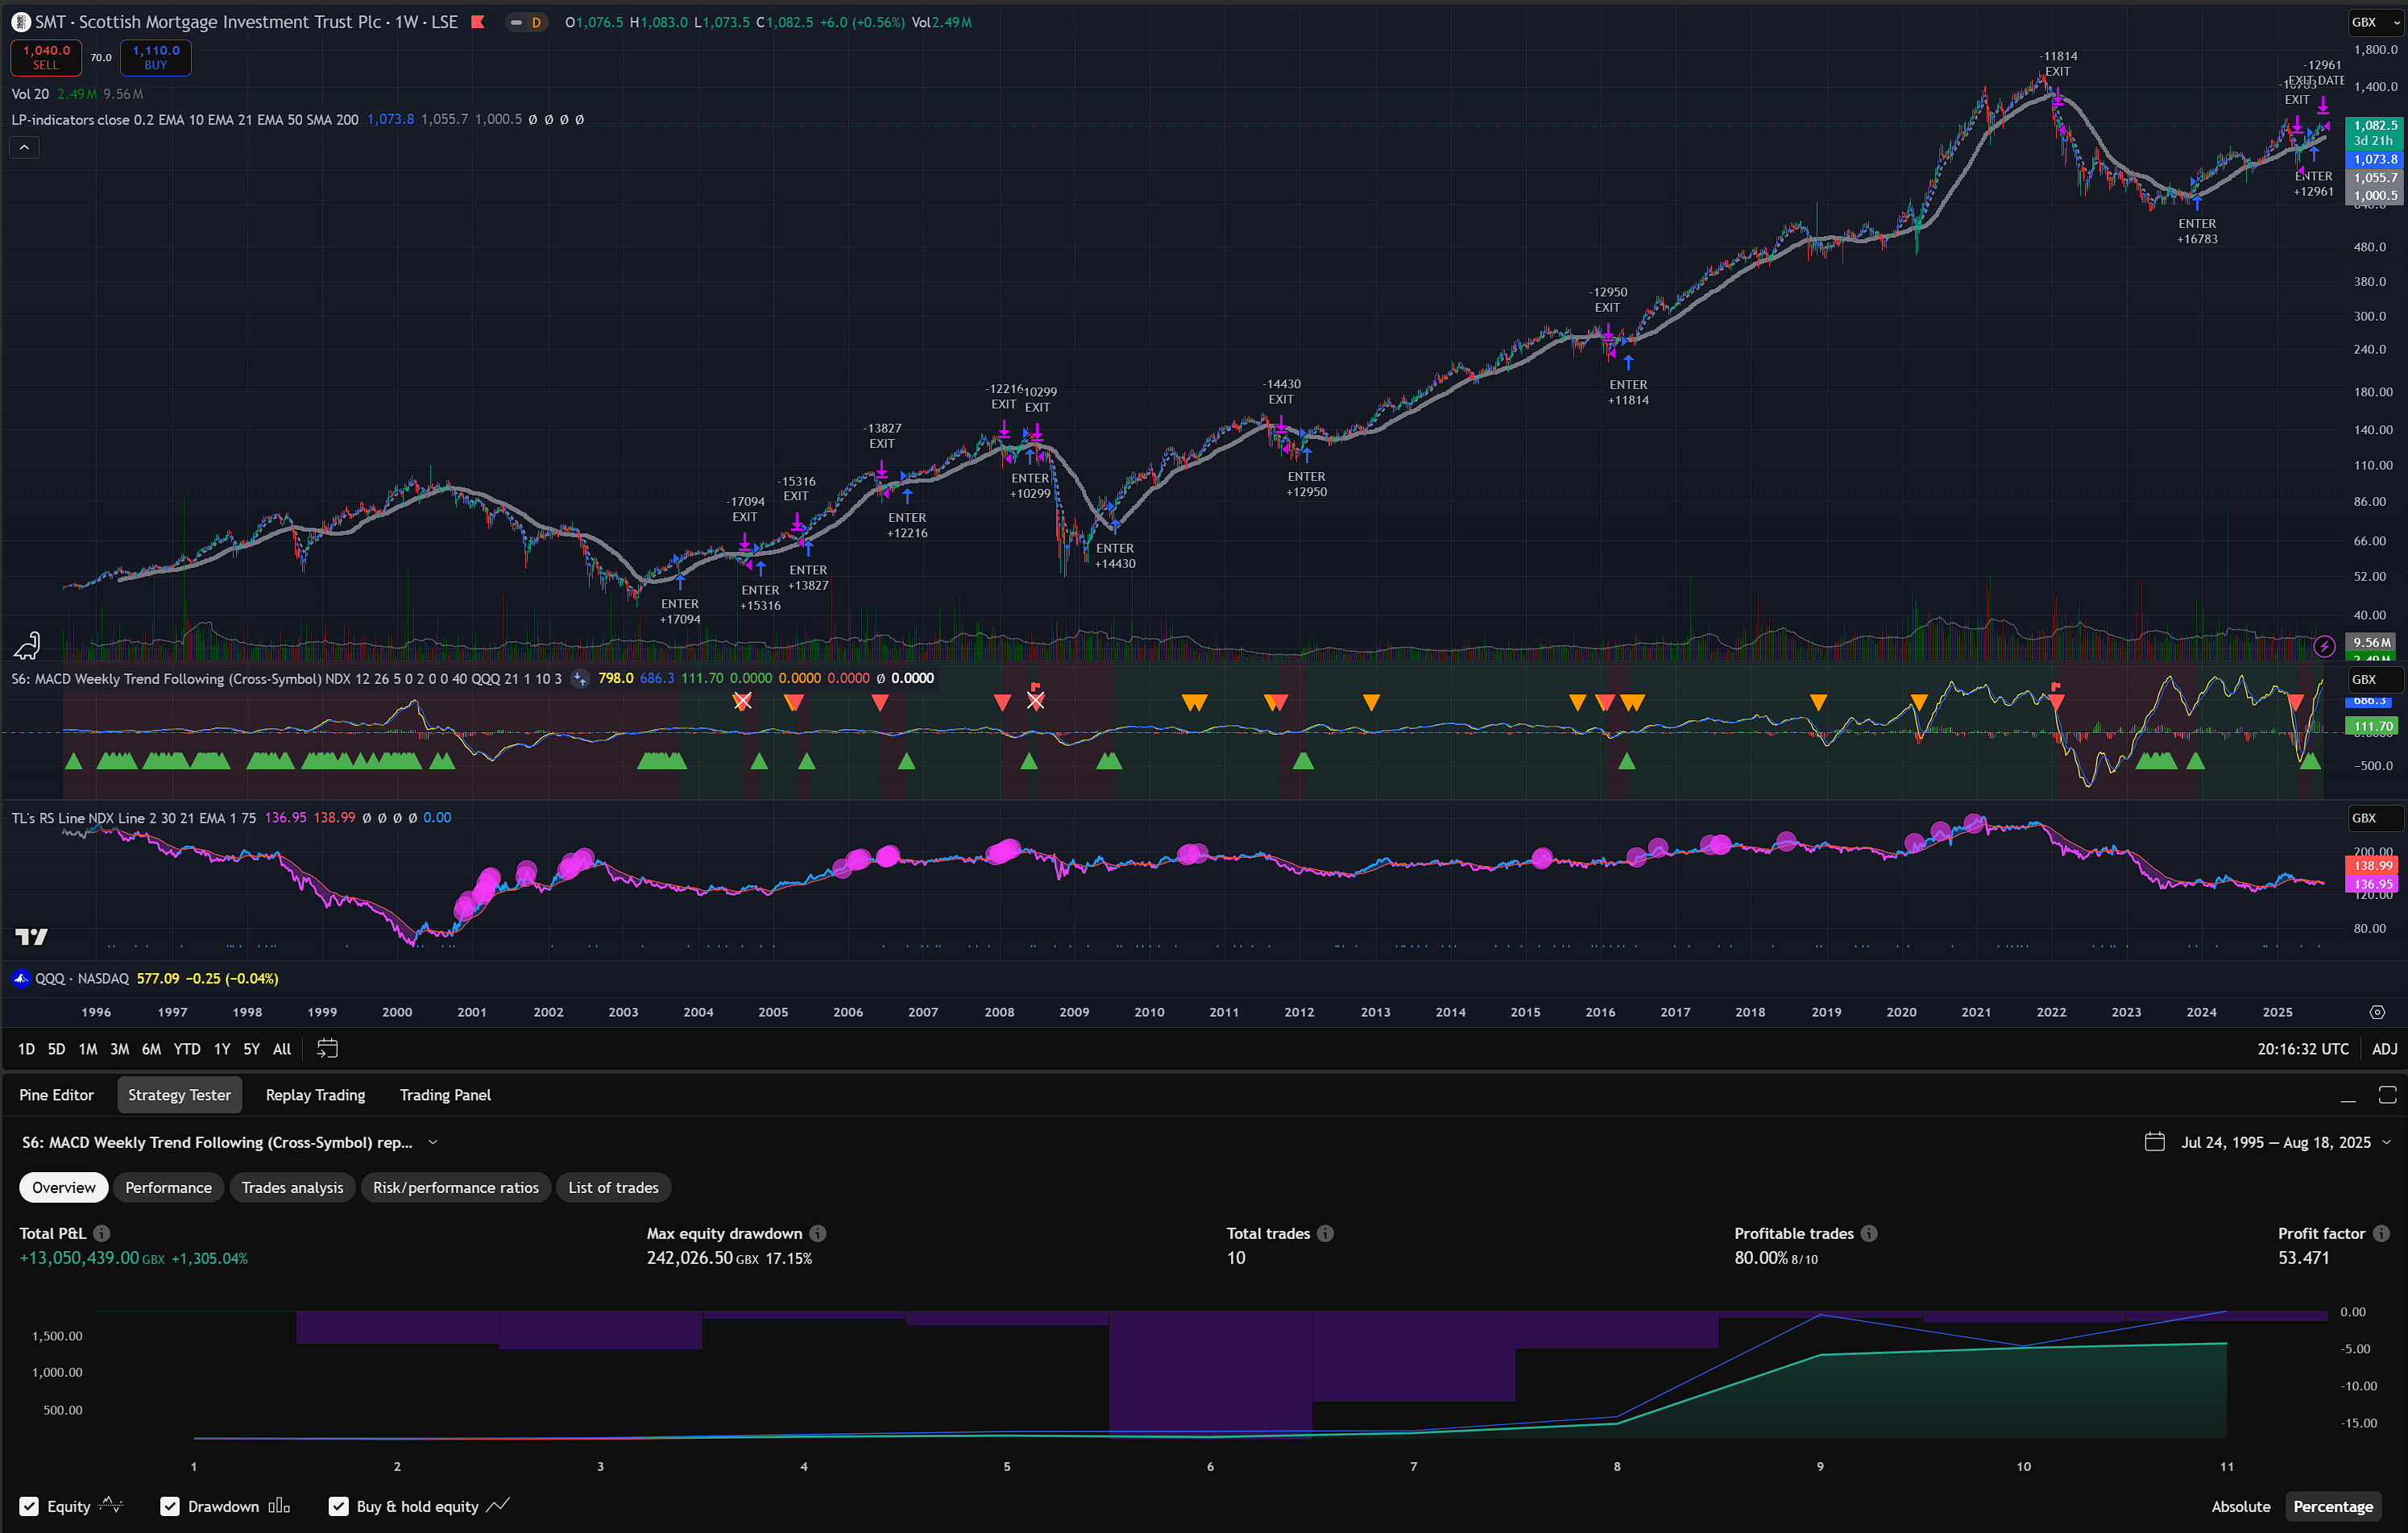
The purple chart (3rd top to bottom) shows the relative strength of SMT against the Nasdaq 100 Index (NDX). When the line is purple SMT is weaker, therefore it does not enter a position (see the green triangles until mid-2001), and when the line is blue SMT is stronger than NDX and positions can be entered.
AVGO with QQQ signal
- Dates: 2009-08-03 to 2025-07-31
- Configuration:
BufferPct=2% - Results: +6,000% PROFIT (Note the 100% win rate!)
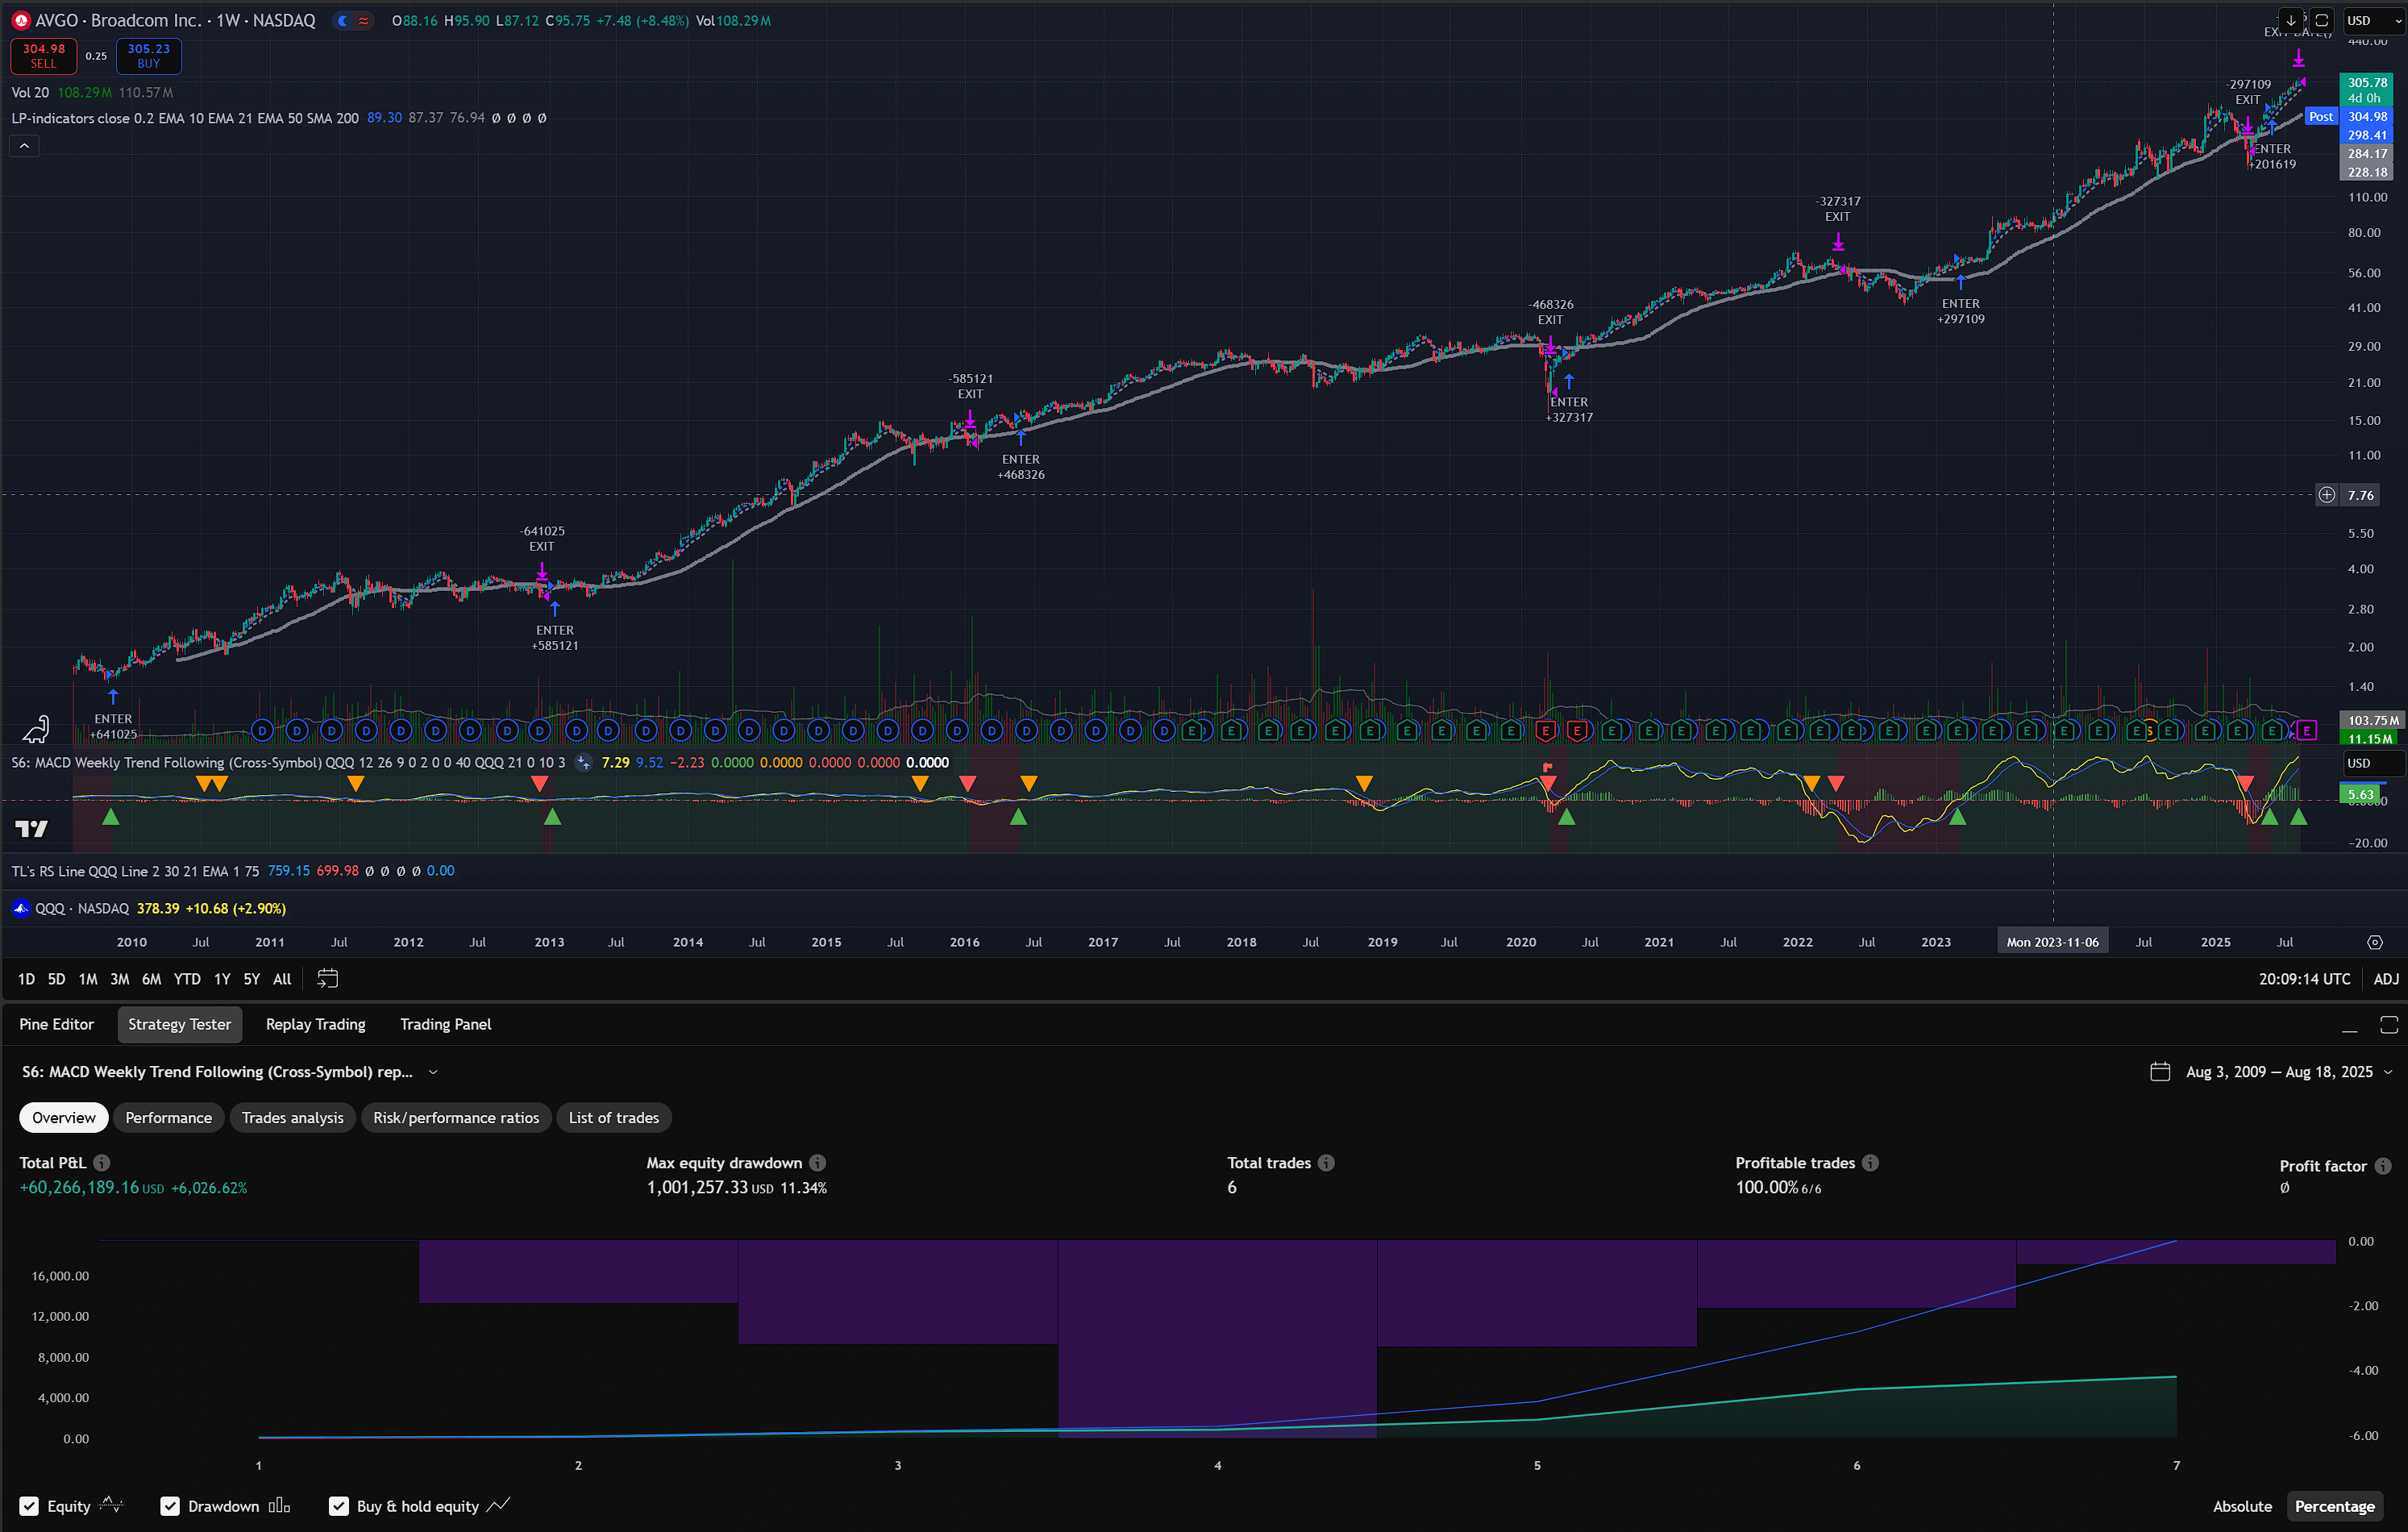
And with NDX instead of QQQ! +6,159% PROFIT
Although, to be fair, it was quite hard to lose money holding AVGO in the past 15 years. The stock just goes up. Even with the buy and hold strategy AVGO only had a max of 35-40% drawdown occasionally, so if you could stomach those you would win big.
The strategy’s goal though is to not have to stomach more than what we want, and still try to capture much of the profit.
UPRO with SPX
- Dates: 2010-06-01 to 2025-07-31
- Configuration:
BufferPct=2%, EntryStopLoss=15%, DynamicStopLoss=30% - Results: +1,700% PROFIT
UPRO is the 3x daily leveraged ETF of the S&P 500 index, and SPX is the S&P 500 Index.
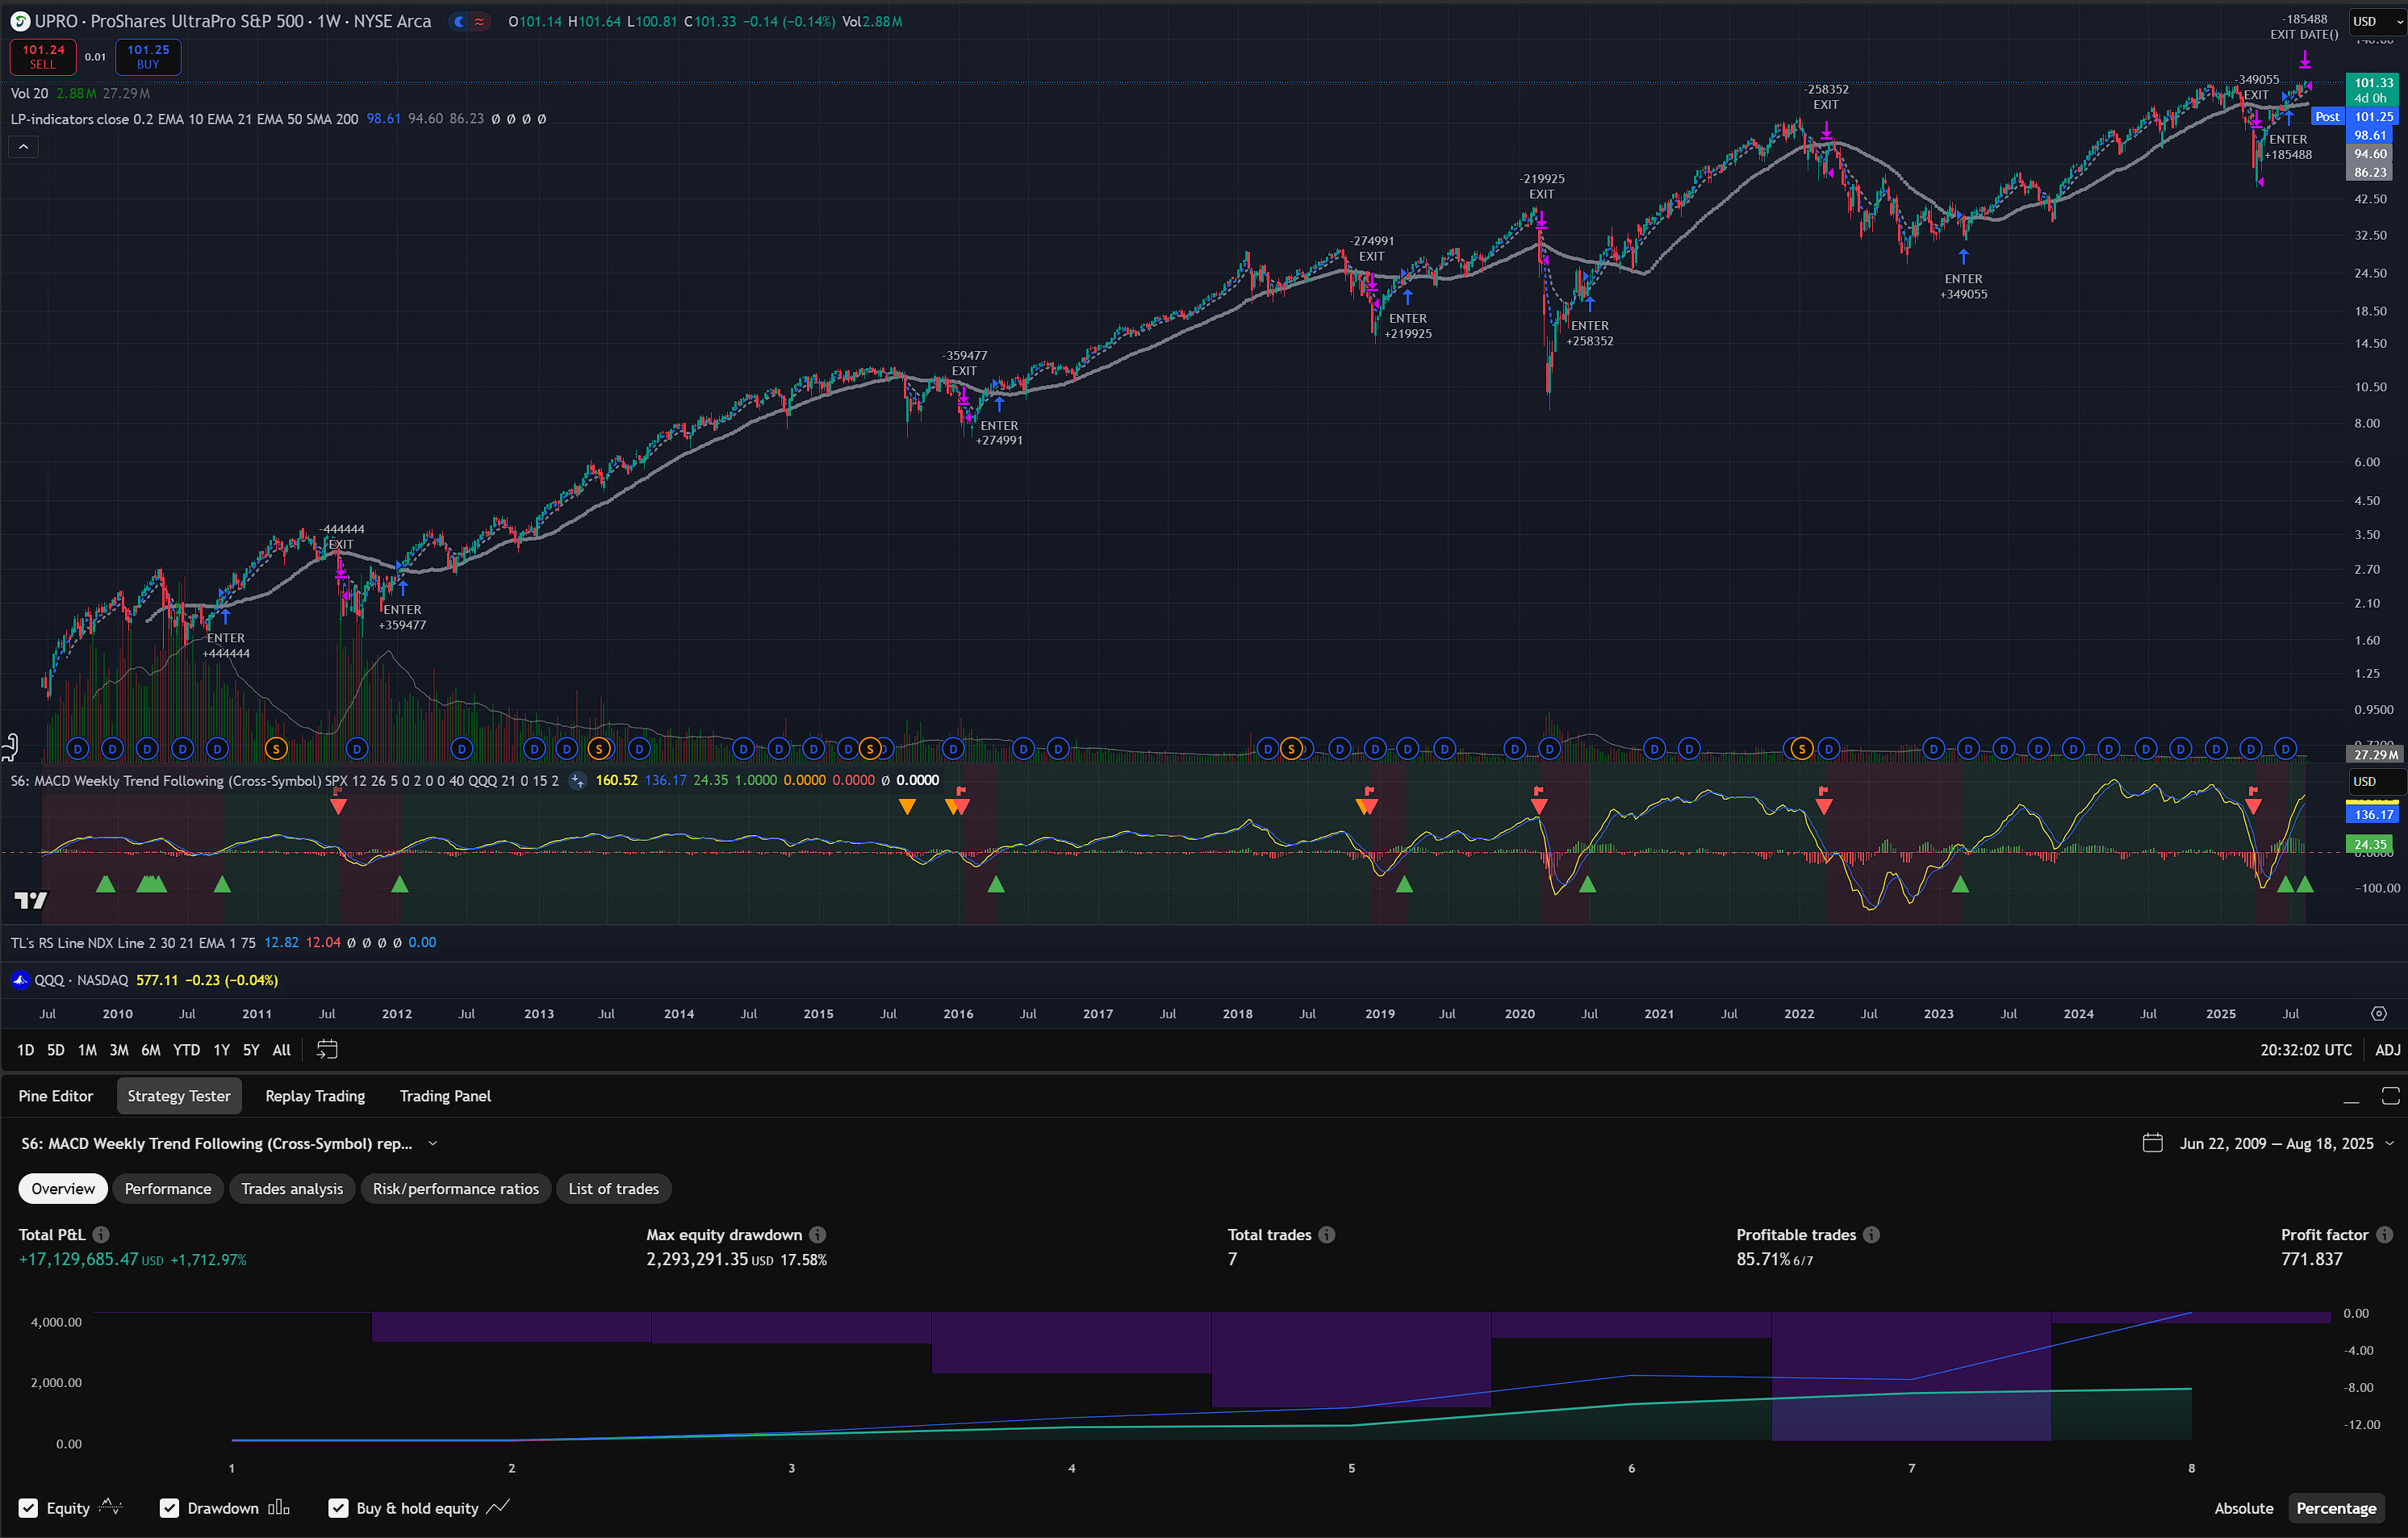
The 40-week SMA crossover strategy with the 2% exit buffer would return +1,100% PROFIT and when using the SPX as signal +2,000% PROFIT.
Open questions
The one question we are still researching and backtesting is how to add more money into an existing position.
Everything is mechanical around entering a position and exiting a position, but considering that some periods span multiple years we need a robust way to add more money into the position even if just a few times per year, without negatively impacting our risk management.
Conclusion
This is super fun, isn’t it.😉
I suggest you read the publication “Leverage for the Long Run - A Systematic Approach to Managing Risk and Magnifying Returns in Stocks” to see the impact of having a strategy to manage risk and reduce drawdowns while also taking advantage of leverage to magnify profits.
The basis of my strategy, and any strategy using the leveraged ETFs, is that the bull markets happen regularly and they are big enough to offset the losses from bear markets when managed properly.
If you have better ideas or improvements to my strategy, feel free to reach out on @lambrospetrou or email me.
Changelog
- 2025-11-14: Fixed the TQQQ with QQQ signal screenshot, incorrectly showing QQQ3.
- 2025-08-19: Minor edits and new section on EQQQ vs NDX. Fixed the 200D-SMA crossover screenshot.
- 2025-08-18: Initial public post.
- 2025-08-17: Initial draft, not publicly listed.